First Great Plains Chase of 2011 This Wednesday

At last, the setup I’ve been waiting for–one that warrants dipping into my tight finances in order to make the 1,000-mile drive to the Southern Plains. To date, this present system has been a miserable disconnect between upper-level support and instability, with a nasty cap clamping down on the whole shebang. Last night it managed to cough up a solitary tornado in South Dakota. That was it. I’m not sure what today holds, but I haven’t seen anything to excite me about it or tomorrow.

But Wednesday…ah, now we’re talking! The SPC places a large section of the Great Plains under a slight risk, and their discussions have been fairly bullish about the potential for a wide-scale event. At first I couldn’t see why. My mistake–I was looking at the NAM, which with straight southerly H5 winds has not provided the best PR for Wednesday’s setup. But once I glommed the GFS, I got a whole ‘nother picture, one which the SREF and Euro corroborated.

That was last night. I haven’t looked at today’s SREF, and the new ECMWF gives me a slight pause as its now somewhat negative tilt has slightly backed the mid-levels from the previous run. But only slightly. The H5 winds still have a nice southwesterly flow, and taking the three models together, everything you could ask for is lining up beautifully for tornadoes in the plains.

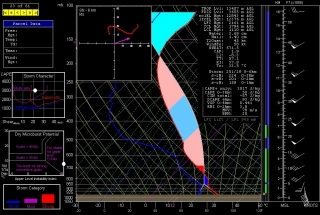
The event promises to be widespread, with a robust dryline stretching from a triple point in southwest Kansas south through Oklahoma and Texas. Positioned near a dryline bulge, Enid, Oklahoma has drawn my attention for the last couple of GFS runs. Check out this model sounding for 00Z and tell me what’s not to like about it. Everything is there, including a voluptuous hodograph and 1 km SRH in excess of 300 m^2/s^2.

Other places in the region also look good, though. Farther south in Texas, Wichita Falls shows potential. Helicity isn’t as persuasive as Enid, but the CAPE tops 3,000 J/kg and there’s less

convective inhibition. Here’s the sounding for you to compare with Enid.

I haven’t been as drawn to Kansas so far, but with the triple point perched there, storms are bound to fire up just fine in the Sunflower State. The details will work themselves out between now and Wednesday evening. Significantly, the tyrannical cap of the previous few days no longer appears to be an issue.

The bottom line is–it’s time to head West! This evening I’m taking off for the plains with my long-time chase buddy Bill. At last! Time to sample what the dryline has to offer, and–now that I’m equipped with a great HD camcorder–finally get some quality footage of a tornado or two.

There’s no place like the Great Plains! YeeeeHAW!!!!!
Mesoanalysis Maps Now Available

If you’ve used the F5 Data RUC maps on my Storm Chasing page, then you’ll be pleased to know that, after a couple of days being unavailable, the maps are once again up, with some significant changes that I think you’ll like.

My initial intention when I took the maps down was to install RUC loops in their place, but I hit a snag. It’s just a temporary one, but in the meantime, I’ve decided that instead of reinstalling the original RUC maps, I’d switch to the new mesoanalysis maps that F5 has recently added to its suite of forecasting tools. I like them well enough that I may not even bother with the RUC loops. You can find plenty of sources for RUC, but not for these, so the mesoanalysis maps should give you a different and useful resource. Besides being proprietary to F5 Data in themselves, they include a couple of trademark indices that Andy Revering has formulated for capping and sigtors.

Check them out and let me know what you think. I welcome your comments.

Midweek Severe Weather Potential for the Midwest

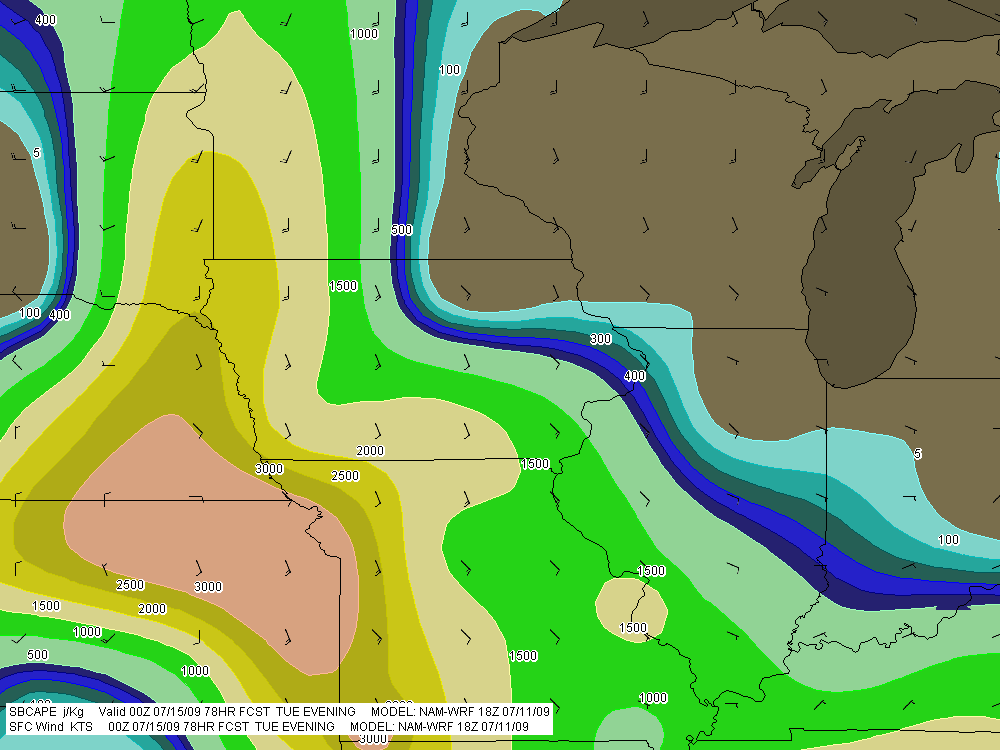
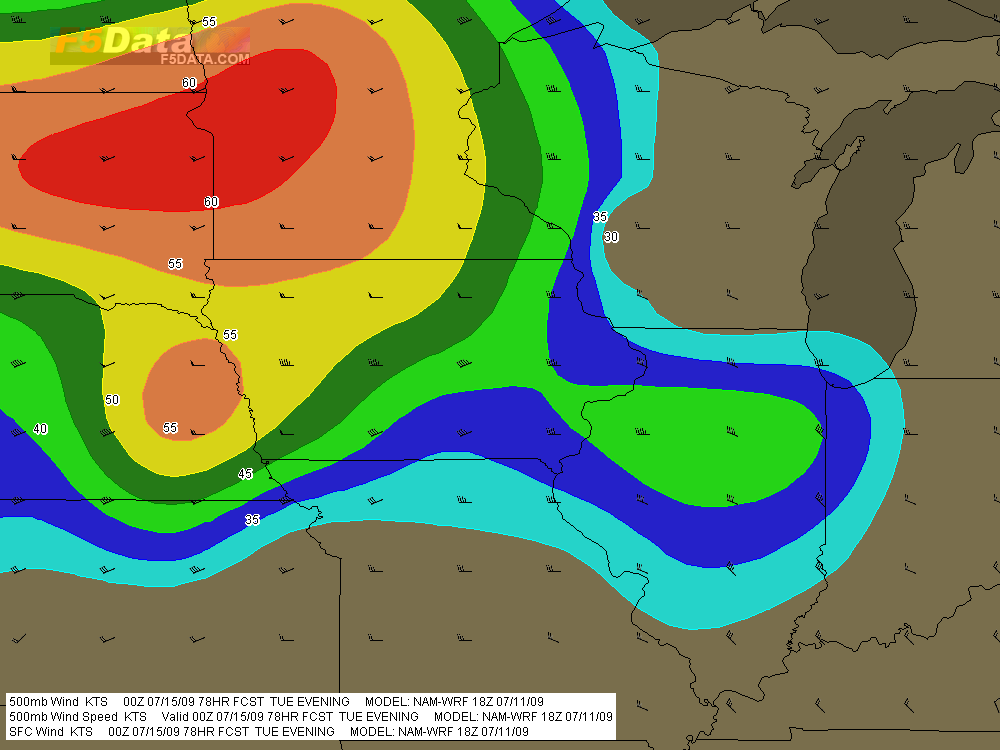
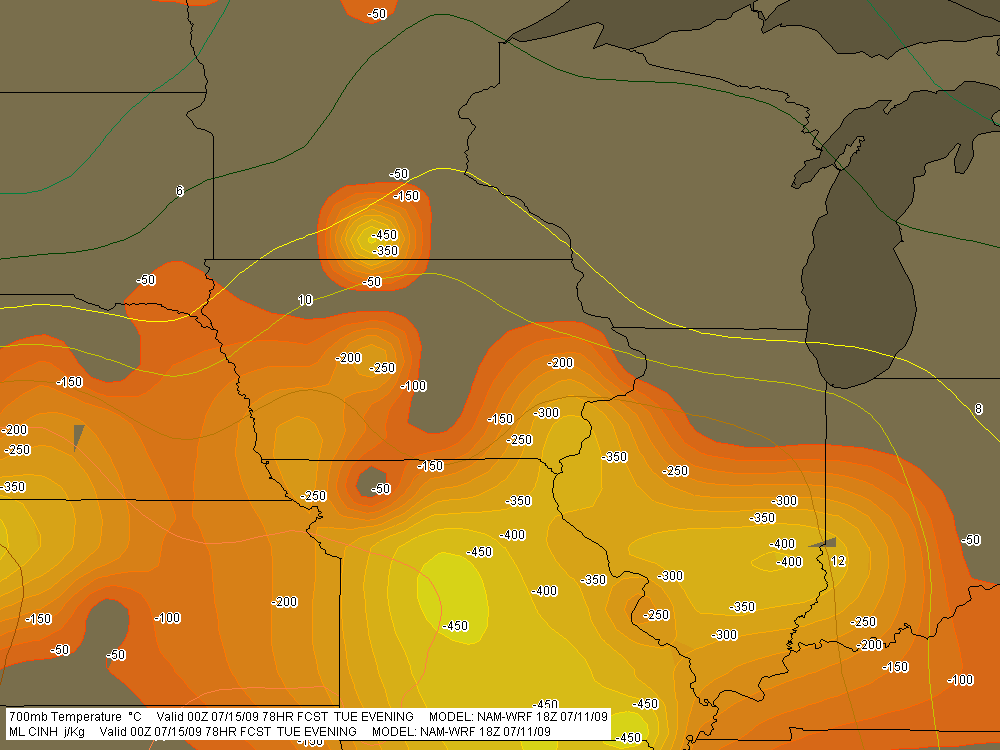
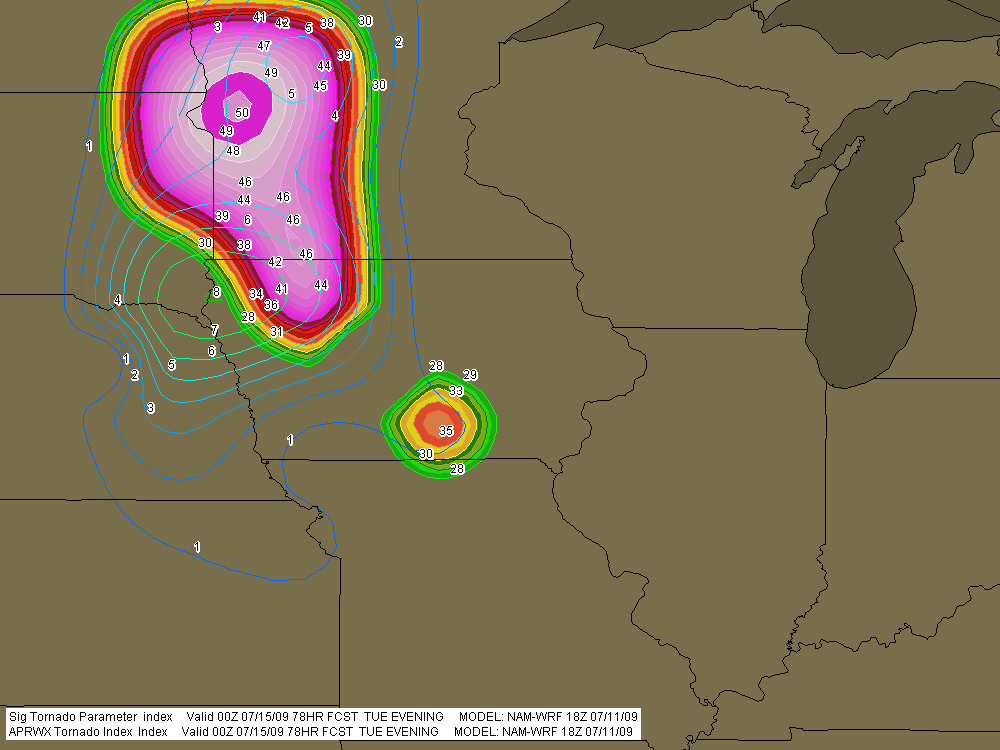
A significant weather event appears to be shaping up for the northern plains and cornbelt this coming Tuesday. For all you weather buffs and storm chasers, here are a few maps from the 18Z NAM-WRF run for 7 p.m. CT Tuesday night (technically, 00Z Wednesday), courtesy of F5 Data.

A couple items of note:

* The NAM-WRF is much less aggressive with capping than the GFS.  The dark green 700mb isotherm that stretches diagonally through central Minnesota marks the 6 C contour, and the yellow line to its south is the 8 C isotherm.

* The F5 Data proprietary APRWX Tornado Index shows a bullseye of 50, which is quite high (“Armageddon,” as F5 software creator Andy Revering puts it). The Significant Tornado Parameter is also pretty high, showing a  tiny bullseye of 8 in extreme northwest Iowa by the Missouri River.

Obviously, all this will change from run to run. For now, it’s enough to say that there may be a chase opportunity shaping up for Tuesday.

As for Wednesday, well, we’ll see. The 12Z GFS earlier today showed good CAPE moving into the southern Great Lakes, but the surface winds were from the west, suggesting the usual linear junk we’re so used to. We’ve still got a few days, though, and anything can happen in that time.

SBCAPE in excess of 3,000 j/kg with nicely backed surface winds throughout much of region.

SBCAPE in excess of 3,000 j/kg with nicely backed surface winds throughout much of region.

500mb winds with wind barbs.

500mb winds with wind barbs.

MLCINH (shaded) and 700mb temperatures (contours).

MLCINH (shaded) and 700mb temperatures (contours).

APRWX Tornado Index (shaded) and STP (contours). Note exceedingly high APRWX bullseye.

APRWX Tornado Index (shaded) and STP (contours). Note the exceedingly high APRWX bullseye.

Convective Inhibition: SBCINH vs MLCINH

Some months back, I wrote a review of F5 Data, a powerful weather forecasting tool that aggregates a remarkably exhaustive array of atmospheric data–including over 160 different maps and a number of proprietary indices–for both professional and non-professional use. Designed by storm chaser and meteorologist Andrew Revering, F5 Data truly is a Swiss Army Knife for storm chasers, and thanks to Andy’s dedication to his product, it just keeps getting better and better.

My own effectiveness in using this potent tool continues to grow in tandem with my development as an amateur forecaster. Today I encountered a phenomenon that has puzzled me before, and this time I decided to ask Andy about it on his Convective Development forum. His insights were so helpful that, with his permission, I thought I’d share the thread with those of you who are fellow storm chasers. If you, like me, have struggled with the whole issue of CINH and of figuring out whether and where capping is likely to be a problem, then I hope you’ll find this material as informative as I did.

With that little introduction, here is the thread from Andy’s forum, beginning with…

My Question

SBCINH vs MLCINH

I’m looking at the latest GFS run (6Z) for Saturday at 21Z and see a number of parameters suggesting a hot spot around and west of Topeka. But when I factor in convective inhibition, I get either a highly capped environment or an uncapped environment depending on whether I go by MLCINH or SBCINH. I note that the model sounding for that hour and for 0Z shows minimal capping, which seems to favor the surface-based parameter.

From what I’ve seen, SBCINH often paints a much more conservative picture of inhibition, while MLCINH will show major capping in the same general area. How can I get the best use out of these two options when they often paint a very different picture?

Andy’s Answer

This is a great question, and very well worded… I guess I should expect that from a wordsmith!

SB *anything* is calculated using a surface-based parcel. ML *anything* is calculated using a mixed layer parcel. It is done by mixing the lowest 100mb temperature and lowest 100mb dew points and using those values as if those values were the surface conditions, and then raising from those values.

This is why when you look at a sounding it looks to favor the SB CIN because the parcel trace on those soundings is always raised from the surface. If you were to ‘average’ or mix the lowest 100mb temperatures by simply finding the section of the temperature line that is 100mb thick at the bottom of the sounding, and find the middle of that line (average value) and see what that temperature is, and then go to the surface and find where that temperature would be on the sounding at the surface, and raise the parcel from there (after doing the same thing with the dewpoint temperature) then you will have the ML Parcel trace and would then have MLCIN and MLCAPE to look at in the sounding.

A drastic difference in capping from SBCIN to MLCIN indicates that there is a drastic difference in values just above the surface that are causing this inconsistency. So when the parcel is mixed it washes out the uncapped air you get from the surface value.

We have different ways of looking at these values with different parcel traces because quite frankly, we never know where this parcel is going to be raised from. The same idea is why we have Lifted Index and Showalter Index. ITs the same index, but Showalter uses the values at 850mb and pretends thats the surface, while Lifted Index uses the surface as the surface.

We just never know where the parcel is going to raise from.

It seems to be consensus that ML-anything is typically the favored parcel trace. This means smaller CAPE and bigger CIN usually.

I have stuck strictly to my APRWX CAP index for years now because it considers both of these, as well as the temperature at 850mb, 700mb, and temperatures at heights from the surface up to 3000m, cap strength/lid strength index, as well as some other things when looking at capping. It seems to perform very well.

To summarize though… capping is a bear. If anything is out of line, you’ll easily get capped. So what I do is look at every capping parameter I can, and if *anything* is suggesting it being capped, then plan for it to be capped during that time period.

Now to confuse the situation even more, keep in mind that capping only means that you won’t get a storm to take in parcels from the suggested parcel trace location… IE.. from the surface. You can be well capped and have elevated storms above the cap. However for them to be severe you tend to need ‘other’ parameters in place, such as very moist air at 850mb (say 12c dew), some strong winds at that level, etc. to feed the storm.

Another map that is neat to look at for capping is the LFC-LCL depth. You may be capped, but want to be in position where the cap is ‘weakest’ and may have the best chances at breaking… with this map you get into your area of interest and then look at this map and find where the LFC-LCL depth is ‘smallest’.

For a capped severe situation, this usually means high values with a donut hole of smaller values in the middle. This is a great indication that the cap would break most easily in the middle of that donut.

This map (in a different, but similar form) can be seen on the SPC Mesoanalysis web site as LFC-LCL Relative Humidity. Its the same idea, but on their map you want high humidity values for weakening cap indication.

——————

So there you have it–Andy’s manifesto on capping. It’s a gnarly subject but an important one, the difference between explosive convection and a blue-sky bust. There’s a lot more to it than looking at a single parameter on the SPC’s Mesoanalysis Graphics site. If nothing else, this discussion has brought me a step or two closer to knowing how to use the ever-increasing kinds of forecasting tools that are available.

Severe Weather Forecasting Workshop and Southern Plains Drought

It’s Thursday, and I’m in Louisville, Kentucky, with my buddy Bill. He’s got business here, and I’m taking care of business here on my laptop, and then we head to Norman, Oklahoma, for a severe weather forecasting workshop with Tim Vasquez. At times like this, I’m grateful for the freedom and mobility that come with being a freelance writer. As long as there’s work for me to do, I can do it pretty much anywhere provided I have my laptop and Internet access.

I’ve been hoping to catch a little early-season convective excitement this Saturday. Not sure that’s going to happen, though. The wild card seems to be moisture, but capping may also be a problem. It would be a shame to make the journey to Oklahoma and not see a little decent, Great Plains weather. Of course, that’s not the focus of the trip–the forecasting workshop is–but still, a supercell or two would be nice. Unfortunately, it looks like a cold front will provide the lift that finally busts the cap, and that suggests “linear.”

Sunday is the workshop, so I don’t much care what the weather does that day. I’ll be in class.

Monday may offer another crack at things, and it may be our best opportunity. It’s too far out to say (for that matter, Saturday is still a bit too far off yet to feel either good or bad about it), but assuming that the southern Plains at least get a bit of rain to relieve their dry spell and give the ground a good soaking, moisture may not be the question mark that it is for Saturday’s setup.

Frankly, the current forecast discussion on Stormtrack is the first time I’ve given serious thought to the effect of soil conditions on convection. I had always thought of ground moisture and evapotranspiration as just enhancements to the return flow, not potential deal-breakers. To my mind, a nice, deep low pulling in rich dewpoints from the Gulf of Mexico would more than compensate for dry regional conditions. But more than one seasoned Great Plains storm chaser has looked at the current drought conditions in Texas and Oklahoma and opined skeptically about the chances for 2009 being a good chase year in the West unless the region sees some rain.

Ah, well. The season hasn’t even begun yet, so I’ll take what I can get and hope for better as we move into May and June. Right now, it’s nice to simply see the sun shine, feel fifty-degree temperatures, and know that winter is drawing to a close.