Maps Coming to RAOB Sounding Software

Welcome to 2014! I’m going to refrain from writing the typical New Year’s Day stuff here, having already shared my greeting and reflections on Facebook. Instead, I want to share  one of the cool new things this New Year has brought in.

For some time now, deep in a hollow tree, John Shewchuk has been hard at work, and now, at last, he has rolled out something that is sure to make your mouth water: worldwide data maps for his RAOB software.

Okay, so it’s not a new cookie and John is not a Keebler elf. What he is, is the creator of the world’s most powerful and versatile atmospheric sounding software, which, thanks to John’s ongoing quest for excellence, keeps getting better all the time.

I am an unabashed RAOB fan, and I’m far from alone. John’s clients, both government and private sector, are legion and worldwide and firm believers in the phenomenal firepower of John’s brainchild. I am probably the humblest and least sophisticated of the bunch, not being a weather researcher or an operational forecaster but merely a layman with an avid interest in storm chasing. I purchased the core software several years ago along with a number of the modules, and I quickly realized that the capabilities of RAOB far outstripped my knowledge of the atmosphere, to say nothing of my technical expertise. I will add that I’ve learned a bit since then, particularly in the first area, thanks in part to RAOB, whose commonsense design has made the meteorological insights that soundings have to reveal easier to access for even a non-tech such as me.

And that underscores what is, in my book, one of RAOB’s most glowing attributes: its ease of use. I don’t have to be a geek in order to make it go. It’s much easier and faster to use than Bufkit, which, though feature-rich and free, I never could figure out. And now, with the addition of worldwide data maps, the RAOB user interface becomes even more intuitive and convenient.

RAOB Map US
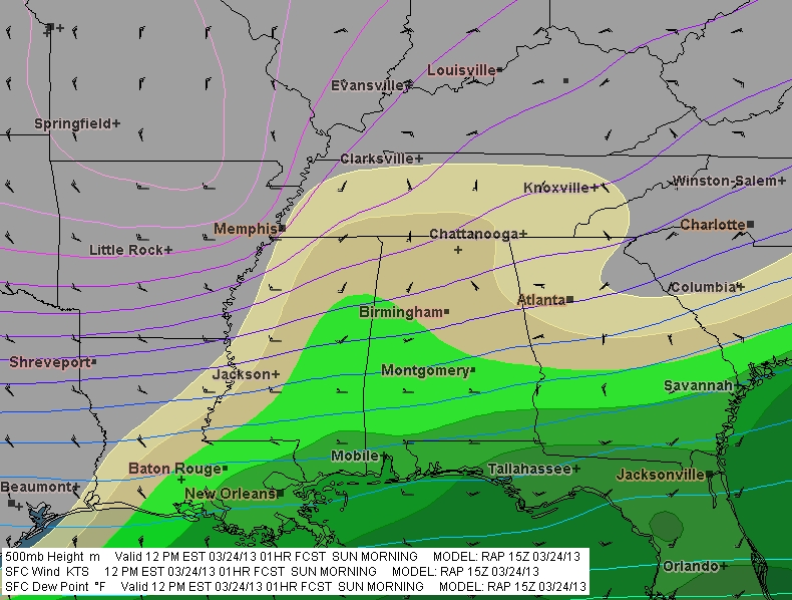
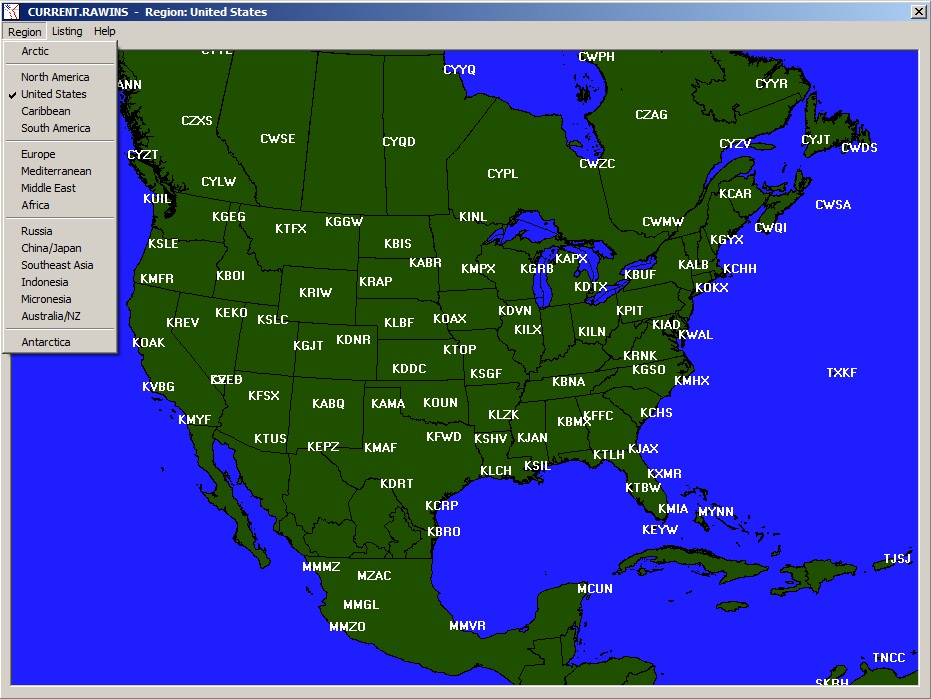
Here is an example of one of the maps. As you can see from the pulldown menu, there are other options which, altogether, cover the entire globe, including the polar regions. They are the latest improvement to the version 6.5 beta test and apply only to WMO soundings, not forecast soundings such as GFS or NAM. The latest update to the maps completes phase 1 of the mapping project. A recent newsletter stated that “phase 2 will enable creation of cross-sections by just drawing a line across the data maps. ” That will be an immensely useful feature for setting up spatial (versus temporal) cross-sections.

Bottom line: Big kudos and thanks to John–who, by the way, works out of his home in Matamoras, Pennsylvania, not in a hollow tree. Sorry to disillusion you. But if you’re a storm chaser or a weather buff, what he turns out goes far beyond anything the Keebler elves ever dreamed of.

I should add, this is neither a paid nor solicited review. I have written it strictly as a service to fellow storm chasers and because I love John’s work.

F5 Data: A Swiss Army Knife for Storm Chasers Adds Some Superb New Tools

I first began using F5 Data in 2007, and despite its early developmental quirks and my own vast lack of experience at forecasting, I fell in love with it. Storm chaser and program designer Andrew Revering had a solid and unique concept, one that gave me an ample tool for both learning forecasting and chasing storms. In particular, its configurable overlay of RUC maps on top of my GR3 radar images (via Allisonhouse’s data feed) appealed to me. At a glance, I could get a good idea of the kind of environment storms were moving through and into. And I had more than 160 parameters to choose from. I hadn’t an inkling what most of them were for, but they were available to me if ever I learned.

In 2008, Andy made significant upgrades to his product with the addition of color shading and contouring, GFS at 3-hour intervals out to 180 hours, a calculator for instantly converting various units of measurement to other units of measurement ( such as meters per second to knots and miles per hour), and other improvements.  The result not only looked attractive and professional, but it offered more solid bang for the buck–and at a little over $14.00 a month, the bucks were easily affordable.

Map Overlays: An Immensely Useful Feature

500 mb Heights

CONUS view showing 500 mb height contours. Note: Images shown here do not correspond to the text example.

At the same time, my own forecasting skills were slowly improving, and as they did, I came to greatly value another key feature of F5 Data: its ability to layer any of its maps on top of each other. This is a hugely useful feature and one I haven’t seen in any other commonly available forecasting resource that doesn’t require more technical skills than I possess. F5 Data is easy and intuitive to use, and as my knowledge grew, so did my appreciation for its map overlays.

F5 Sample Overlays

CONUS view with shaded surface dewpoints and surface wind barbs added to 500 mb heights contours. Labels for dewpoints have been turned off.

F5 Overlays Zoomed

Same overlays as above zoomed in to selected area.

Say, for instance, I’m looking at the NAM 48-hour forecast for 21Z. I select the 500 mb heights map, choosing the contour setting, and see a trough digging into New Mexico, with diffluence fanning across the Texas/Oklahoma panhandles up into Kansas. How is the boundary layer responding? Switching from contours to shading, I select sea level pressure, and now, superimposed on the H5 heights, I can see a 998 mb low centered in southwest Kansas. Another click adds surface wind barbs, which show a good southeasterly flow toward the low, with an easterly shift across northern Kansas suggesting the location of the warm front. Hmmm, what’s happening with moisture? Deleting the SLP map–I don’t have to, but too many maps creates clutter–I select surface dewpoints. Ah! There’s a nice, broad lobe of 65 degree Tds stretching as far north as Hutchinson, with a dryline dropping south from near Dodge City into Oklahoma and Texas. Another click gives me an overlay of 850 mb dewpoints, revealing that moisture is ample and deep. Still another click shows a 70 knot 500 mb jet core nosing in toward the panhandles.

You get the idea. I can continue to add and subtract maps of all kinds–surface and mixed-layer CAPE, 3 km and 1 km storm-relative helicity, bulk shear, 850 mb wind speed and directional barbs, EHI, STP, moisture convergence, and whatever else I need to satisfy my curiosity about how the system could play out two days hence. I can see at a glance favorable juxtapositions of shear, moisture, lift, and instability per NAM. And I can make similar comparisons with GFS, and on day one, with RAP (which replaced RUC in May 2012).

And Now the Upgrade: Presenting Version 2.6

Everything I’ve written so far has been to set a context for what follows, which is my review of the latest major upgrade to F5 Data. It comess at a time when the number of forecasting products available online has greatly expanded and old standbys have updated in ways that make them marvelously functional. Notably, a number of years ago TwisterData gained rapid and massive acceptance among storm chasers, and it continues to enjoy prominence as a quick, one-stop resource. Like F5 Data, it features GFS, NAM, and RAP, and it also offers point-and-click model soundings, a very handy feature. In 2010, the HRRR brought hourly high-resolution maps to the fray, with its forecast radar images demonstrating considerable accuracy. And the SPC’s Mesoanalysis Graphics, always a stellar chase-day resource, has recently made some dynamite improvements. Today the Internet is a veritable candy store of free forecasting resources.

GR3 with F5 mesoanalysis overlay. This one shows surface and 850 mb Tds and 850 wind barbs. (The blue wind barbs are an Allisonhouse product.)

GR3 with F5 mesoanalysis overlay. This one shows surface and 850 mb dewpoints and 850 mb wind barbs. (The blue METARs are an Allisonhouse product.)

At the same time, F5 Data didn’t seem to be doing much, and while I still resorted to it constantly, I wondered whether Andy had lost his passion and commitment to his product. Most troubling to me, the proprietary mesoanalysis maps which had replaced the RUC maps as GR3 overlays often failed to update in a timely manner, rendering them pointless. Given their potential usefulness in the field–how valuable would it be, for instance, to see at a glance that the storm you’re following is moving into greater instability and bulk shear?–I found this disappointing.

But I no longer have any such concerns. This latest upgrade has rendered F5 Data a powerhouse. All the while, Andy was beavering away in the background, fixing bugs and incorporating various client requests into his own set of huge improvements to his creation. Beginning with the February 1, 2013, release of v. 2.5 and moving in seven-league strides toward the latest version, 2.6.1, these changes have been a long time coming, they reflect a lot of work on Andy’s part, and they have been well worth the wait.

Here’s What Is New

The following will give you a quick idea of the more significant changes:

  • NAVGEM has been added to the F5 suite of forecast models.
  • Users can now draw boundaries, highs, and lows.
  • Users can select increments other than the default by which arrow keys advance forecast hours for the different models
  • The map now offers an experimental curved-Earth projection.
  • Wind barbs at different levels can be overlaid to provide visuals of speed and directional shear.
  • Processing is faster (up to 45 minutes faster with GFS)
  • Text for geographic maps can now be customized.

And yes, the mesoanalysis maps are now on the money. Andy moved them to a faster server, and they now update regularly and consistently, to the point where I plan to display some of them on my site the way I used to do with the F5 Data RUC maps.

All of the above are in addition to the already existing array of features. A few of these include the following:

  • Over 160 parameters, including ones you just don’t find elsewhere, such as the Stensrud Tornado Risk and isentropic surfaces, and also a good number of proprietary products such as the APRWX Tornado Index, APRWX Severe Index, and APRWX Cap.
  • Current conditions plus five forecast models: GFS (out to 384 hours), NAM, RAP, hourly mesoanalysis, and the newly added NAVGEM.
  • Mesoanalysis integration with radar products via Allisonhouse (already described).
  • A point-and-click CONUS grid of forecast soundings.
  • Zoom capabilities that let you zero in on areas of interest. Activate the display of cities and roads and target selection gets that much easier.
  • National satellite (visible, water vapor, and infrared) and base reflectivity radar composites.
  • Fully customizable map overlays (as discussed above).
  • 14 categories of maps organized for particular purposes, including Severe, Tornado, Hurricane, Cold Core, Winter, Lift, Shear, and Moisture. These are fully customizable, and you can create your own categories if you wish.
  • Watch and warning boxes.

To describe all of the features that F5 Data offers would take too much space and isn’t necessary. You can find out more at the F5 Data website, which includes a whole library of video tutorials on what F5 Data is and how to use it.

Better yet, you can download the software (it’s free) and try it out for yourself with 17 free maps.

If there is any downside to the upgraded F5 Data, it is minor and purely personal. I miss the passing of the historical data feature some months prior to the main upgrade. That feature allowed me to request data for past forecast dates and hours so I could study chase setups from years gone by. I wish I still had that option. However, I understand that it needed to go in order for Andy to move ahead with his changes. The feature was peripheral to the purpose of F5 Data, evidently it didn’t get used much, and it’s a small price to pay for the big improvements to this forecasting resource.

One thing Andy might consider for a future update would be to break down SBCAPE and MLCAPE contours into smaller increments. CAPE is displayed by intervals of 100 from 0–500 J/kg, which is great; but from 500 up to 3,000, it jumps by units of 500 J/kg, and from 3,000 on up it moves 1,000 J/kg at a time. Realistically, these are just overviews of instability, and they’re in keeping with how most other forecast resources display CAPE. If you want to get more granular, you can always check out forecast soundings. Still, it’s an opportunity for F5 Data to provide a somewhat more incremental breakdown similar to that of TwisterData.

With these last two comments dispensed of, I highly recommend to you the new and improved F5 Data. It’s easy to use and flexible as all getout, and it puts a squadron of tools at your disposal, all in one eye-pleasing, zoomable interface. Of course, no one forecasting resource covers all the bases, and that is certainly true of F5 Data. But this is nonetheless a fabulous product that offers some unique advantages. These latest changes, including the addition of NAVGEM, the ability to draw boundaries, and mesoanalysis graphics that update regularly to provide the most current information, have taken an already fine resource and made it dramatically more useful.

Bravo, Andrew Revering! You do great work.

This review, by the way, is unsolicited and unpaid-for. I’ve been a fan of F5 Data and of Andy from the start, and I’m pleased to share my thoughts about the latest iteration of a product I’ve used extensively and benefited from for a good number of years.


An Interview with Tim Vasquez, Owner of Stormtrack: A Mesoscale Forecasting Expert Shares Reflections on the Past and Glimpses into the Future

Among the various weather-related forums extant today, Stormtrack has one of the longer—perhaps even the longest—track records. Not only so, but it also carries on a rich legacy begun in 1977 when pioneer storm chaser David Hoadley published the first Storm Track newsletter. The newsletter evolved into a magazine, the publishing torch passed on to veteran chaser Tim Marshall, and the print edition ultimately morphed into an online forum for chasers worldwide under the ownership of Tim Vasquez.

Like Stormtrack, Tim has a rich and varied background replete with experiences that range across the weather spectrum, from storm chasing to operational forecasting to education and more. From 1989 to 1998, Tim served as an Air Force meteorologist. As early as 1985, he developed weather analysis software tools, which eventually culminated in WeatherGraphix and Digital Atmosphere. He has also published a series of weather forecasting books, including Severe Storm Forecasting and the Weather Analysis and Forecasting Handbook. Tim’s resources and services—which include nowcasting and forecasting training for storm chasers—are available through his WeatherGraphics website.

Tim is obviously one very busy guy, not to mention one of the most recognized names in storm chasing circles. In this interview, he shares some fascinating, personal perspectives on storm chasing and mesoscale forecasting back in the day as well as today. Amid the cornucopia of forecasting tools and resources that are now available to chasers, it’s eye-opening to learn not only what existed over two decades ago, but also how determined and knowledgeable a person had to be in order to tap into it. And it’s exciting to consider some of the possibilities that the future has in store.

Enough of this introduction. I hope you’ll enjoy what follows.

Interview with Tim Vasquez

.
Question: Owner of Stormtrack.org, the renowned, longstanding forum for storm chasers worldwide. Forecasting software developer, meteorological consultant, severe weather educator, author of a series of outstanding books on storm chasing and forecasting, professional nowcaster … you’ve covered pretty much every base there is, Tim, except for storm chasing tour guide. I don’t think anyone who’s been seriously involved in chasing for even a brief amount of time doesn’t recognize you as one of the gurus of operational forecasting.

In the midst of all that, one of the sides of you with which I think people are least familiar these days is who you are as a storm chaser. Yet unquestionably you’re an extremely seasoned chaser, one of the true veterans. So let’s talk about that part of you, beginning with how it all started. What first got you enamored with severe weather and tornadoes? Was there a defining moment, or moments, back in your formative years?

Tim: I would say the defining moment came in May 1985 when I was at the National Weather Service in Fort Worth. There were never any good forecasting books at the libraries and no Internet, and AMS publications were expensive. The NWS office there had a little reading room, so I used to go over there to sift through their technical library and page through their saved weather maps. One day while I was there, all hell broke loose in the Panhandle. The office didn’t have forecast responsibility in that area, but everyone was watching things closely with things like the Kavouras dial-up radars and phone calls.

That’s when I met Al Moller, whose enthusiasm was infectious. I was able to ask questions and follow what was going on without getting in the way. Another forecaster there gave me a regional surface map and invited me to analyze it.  After I was done, we all worked through my results. By the time I left that evening, Al had told me about Stormtrack and given me Tim Marshall’s phone number and also a small stack of NOAA tech memos, which he dug out of one of the offices.

That’s not to say I hadn’t had a similar experience, as I used to visit the weather station at Clark Air Base in the Philippines and learned the art of the skew-T there. But this particular NWS visit put me on the road to severe weather, chasing, and the art of mesoanalysis.

Q: How old were you when you went on your first storm chase? What were the circumstances and what was it like?

T: I was eighteen. I had spent an entire winter building up a severe weather library and wanted to get my feet wet on the very first slight-risk area of the year.

Unfortunately I was trying a bit too hard to build up credibility, so I did my chase under the guise of a small research project (me and a few friends, but mostly me). I even had a crude, instrumented TOTO box to place in front of an approaching tornado.

As you might suspect, this first chase was very early: mid-February. It was dark by 5:00 p.m., and a few hours later I was in a squall line south of Dallas. The only thing memorable that happened on that chase is that one of the spark plugs somehow came loose on an engine cylinder in my vehicle. I was out in the middle of nowhere, in the dark and the rain, and I puttered into an abandoned gas station. Fortunately, I had prepared for something like this thanks to Tim Marshall’s Texas Tech chase manual. In ten minutes, I fixed the problem and was heading home. That experience reinforced to me the value of carrying tools.

Sometime that year I also dropped the pretense of a chase team and just chased for the enjoyment and education. Many of my chases during the early years were with Glenn Robinson and Gene Rhoden.

Q: Today’s chasers have an incredible wealth of resources at their disposal. But you came up in a time when there was no Internet, no iPhones or laptops or GR3, no GPS, no HRRR or SREF, no computer-generated indices, none of the stuff that people today take for granted. Talk about how you went about forecasting and fining in a chase-day target back then.

T: Interestingly, back in the “old days,” the data was there if you knew how to be resourceful. A few of the dyed-in-the-wool hobbyists of the late 1970s, for example, took advantage of the era before telephone deregulation and were able to get the NOAA Weather Wire and even the same DIFAX feed that the NWS used.  Some of this was available for free on HF radio well into the 1980s, so with that and a one-hundred-pound fax machine which I managed to acquire for free, I was able to get basic model forecasts.

With computer modems, we did have a sort of pre-Internet experience. Hourly observations were not cheap, but I was able to get them from CompuServe or from a number of long-distance dialup sources. I have a huge binder of 1980s hand-plotted maps, but the drudgery of actually drawing the station plots was the main problem. And I saw what AFOS could do. This led me to develop several analysis programs for the Commodore 128 and later the PC (Digital Atmosphere by 1996) so that I could focus on the analysis.

The items we chronically lacked were raw upper air data, which could only be obtained from an expensive provider like Accu-Data; and satellite imagery, due to the sheer expense of adequate display technology. So I wasn’t able to practice the full range of mesoscale analysis techniques until 1989, when I started working in an actual weather station.

Q: When it comes to field experience, what were some of the things you learned early on about reading the sky, interpreting changing conditions, and, as Shane Adams has put it, “working a storm”?

T: Having a solid diagnosis of the atmosphere before you leave the house (or the motel room) is the key thing, because the atmosphere never plays out like you expect. By 11:00 a.m., you have to be completely grounded in what’s happening at the surface and aloft, not just at the target area but also throughout the entire region. There’s rarely any time or opportunity to figure it out all over again once you’re out there.

Also I learned that I can be the one to fill in the gaps in the diagnosis by stopping regularly to take a measurement—not to write in a logbook, but rather to make sure that the winds and moisture are in the ballpark of what I expect them to be.  There have been several times when I thought I was at a good spot along the dryline, but once I dragged out the sling psychrometer, I found the dewpoint to be something like 57 or 58 and wound up repositioning back to the east. Today’s mobile weather stations are excellent for this kind of thing, but visually reading the character of the sky and matching that up to your expectations from the morning diagnosis is still an essential skill.

Once near a storm, I found map-reading and positional awareness to be critical skills. Certainly anyone who’s chased along the Canadian or Red Rivers can attest to this. You not only need to be in the right location, but you also have to make sure you have a way out in case your navigation plan doesn’t work out. Having a good GPS display or a good map reader in the passenger seat is essential.

Q: Describe one or two of your most outstanding chase experiences.

T: Most of the 2000s put me at the desk running the Chase Hotline or helping to take care of my son, who was born in 2003, so a lot of my actual field experiences draw from the 1990s. The historical May 3, 1999, outbreak is definitely near the top. I chased with Gene Rhoden that day. I still have a memorable impression of watching the birth and growth of the storm that would later devastate parts of Oklahoma City. It soon produced tornadoes, but we lost it due to the road network. Then we joined with the Anadarko storm and saw a highly visible, eerie nighttime tornado near Dover.

Another outstanding chase experience that comes to mind is memorable in a different way. This was also in May 1999, I think May 16. I had targeted Crowell, Texas, and I drove the five hours there from Oklahoma City, arriving just in time to adjust westward and catch a tornado coming off the Caprock before it shrank and roped out. It was an average chase success, but in the passenger seat was my soon-to-be-wife, Shannon, on her fifth chase; and in the back was her lifelong best friend, Kathryn, who had just flown up from Houston hoping to see what a storm chase was like. It ended up being the first time either of them had seen a tornado. So this was a fantastic experience for us all, and the nighttime lightning display heading back home was just phenomenal.

Q: Nowadays, major chase days are characterized by a blizzard of live streams and a glut of Spotter Network icons on the radar screen. But you’re nowhere to be found in that mix. That seems to be the case with quite a few veteran chasers. My sense of it is, you want to chase in peace without having a bunch of tag-alongs intrude on your experience. How often do you actually make it out into the field to chase these days? When you head out, what do you seek in terms of the quality of your chase? How would you say your values and approach differ from those of younger chasers?

T: For a fortunate few, storm chasing will be a constant, lifelong activity. But work, school, and family are there too. All of us at one time or another have to deal with things like tightened budgets, a new baby, a new job away from the Plains, medical problems, family problems, car problems, new meteorological passions, new interests, and so on. They’ve caused many veterans to fade from sight, and I’ve dealt with some of those things myself.

But even if I’m not in the field, I’m following the chase day. I have an insatiable passion for forecasting. Who needs Sudoku and crosswords? A meteorological diagnosis is a tremendously awesome and dynamic puzzle, and I feel like I have a brain that not only specializes in unraveling these puzzles but has a kind of dopaminergic reaction to solving them. And there’s so much remote sensing data coming online, in terms of surface data, MADIS, profilers, satellite imagery, WSR-88D data, and now the new dual-polarization radars. I really feel like a kid in a candy store on a storm day, and I have to say I’d feel kind of disconnected being out in the field. It’s not really the end result that I want to see, but the underlying machinery.

So I think that the mesoscale aspect of the chase day, rather than the chase itself, is my calling. That’s not to say that I’m done with chasing. Our needy baby has grown up into a bright and independent kid, the Chase Hotline demands have abated, we’re back in Norman, and I’m always looking at the sky and taking weather photographs. Plus, I’m responsible for Stormtrack. So I probably will be out there again as early as this month. I have an iPad, so maybe I’ll get linked up with one of the networks, too.

Q: What excites you, and what concerns you, about the state of storm chasing today? How do you see it evolving in the next five or ten years?

T: The Internet is making an enormous impact. Ten years ago it simply gave us a way to share pictures and messages and helped to pipe data to our forecast desk. Today it’s providing a two-way street from the world to the storm base. It’s reaching out to more and more mobile devices and extending further into remote regions of the Great Plains. As a result, we’re already seeing a sort of fusion of spotting and chasing and another real-time channel in the warning process.

Furthermore, the Internet is global, so someone in Mongolia or Madagascar can share in the thrill of a tornado developing over empty rangeland near Dalhart as it happens. That’s mind-blowing.

Another development I’m expecting is growth in international chasing. Very few people have any idea of the significance of east India and Bangladesh’s supercells; I think they’re easily comparable to some of the storms we have on the Great Plains. The largest CAPE values I’ve ever seen have always been on the Calcutta soundings. That region is gradually improving its road network and mobile Internet, and real-time data options are just now coming into existence there.  The only limits, of course, are chase budgets and haze.

Back here in the United States, we’re certain to see new advances in forecasting with the new dual-polarization radar upgrades, and as we get experience with these radars and the body of scientific literature grows, I expect that warnings will become even better and that chasers will increasingly find themselves on the “right” storm. Those last fifty miles of the chase are still as critical as they were in 1980.

Q: If you could share three tips or words of advice with contemporary chasers, what would they be?

T: As follows:

  • Chasing: Hydroplaning and nighttime obstacles are the things that have put me in danger more than anything else. I’ve had a lot of close calls with cows basking on the road and downed power lines stretching across lanes. At 60 mph, there’s only a few seconds to react before your destiny either brings you home or into an obituary on Stormtrack.
  • .

  • Forecasting: Diagnose the atmosphere—not necessarily hand-analyze, but sift through all of the observational charts and products before even looking at models. As humans, we tend to develop a bias in the first bits of evidence we see, so if we start with observed data, we bias our forecasts according to what’s actually happening in the atmosphere. My books and classes go into a lot of this.
  • .

  • Community: Support Stormtrack and help our beginners. Over the past couple of years, we’ve seen a fragmentation of the entire chaser community across the social media spheres—Twitter, Facebook, and so forth—which is not an ideal situation. The Stormtrack forum has always been the singular resource for promoting smart, safe, and cooperative chasing. Chasers are welcome to get their start elsewhere, if they wish, but if that happens, I worry there’ll be more anonymity out in the field and more unsafe behavior.

Q: When can we look for Mr. T’s next forecasting workshop in Stormtrack?

T: He’s down in Altus trying to get all the kids to stay in school. I’ll drag him out of there and maybe we’ll get one out this spring.

An Interview with RAOB Developer John Shewchuk

Two of the handier implements in a storm chaser’s forecasting toolkit are the skew-T/log-P and the hodograph. These two charts typically come bundled together, furnishing vertical slices of the upper air that show graphically how the atmosphere is behaving—or, in the case of forecast soundings, is projected to behave—from 100 millibars all the way down to the surface.

If you want to see at a glance how unstable the atmosphere is and how much convective inhibition suppresses that instability, look at a skew-T. If you want to know in what direction and how fast storms are likely to move and how much low-level helicity they’re likely to ingest, consult a hodograph. The skew-T and hodograph, along with a multitude of derived indices that often attend them, provide a wealth of vital information.

Soundings can be obtained from a variety of sources, many of them free. Among those sources, RAOB is in a league of its own. Its website homepage describes it as “the world’s most powerful and innovative sounding software. Automatically decodes data from 45 different formats and plots data on 12 interactive displays including skew-Ts, hodographs, & cross-sections. Produces displays of over 200 atmospheric parameters including icing, turbulence, wind shear, clouds, inversions and more.”

A couple years ago, I purchased the Basic module and several others—the Analytic, the Hodograph and Interactive, the Advanced Cross-Section, and the Special Data Decoders—and thus gained empirical familiarity with the powers of RAOB. It is an amazing program, all the moreso for its ease of use. Yet I have to confess that I’ve only scratched its surface. I simply don’t have the know-how to tap into its full capabilities. The more meteorologically and technically astute a user is, and the deeper one wants to dig into the atmosphere, the more RAOB will deliver.

In this interview, RAOB developer John Shewchuk talks about his brainchild. John presents his bio thus:

My life in three steps: (1) Born at West Point, New York—so I knew I wanted to be a military guy. (2) Started playing the accordion at age eight—because my parents told me to. (3) Got interested in weather during high school—because it fascinated me. Putting the three all together, I went to Penn State for my meteorology degree while playing the “Rain, Rain Polka” at parties for extra income, and I graduated with an ROTC commission in the Air Force. After twenty-two years in the USAF Weather Service, I retired as a lieutenant colonel.

I am now back in my hometown of Matamoras, Pennsylvania, in the house that my grandpa built. Here I operate the RAOB factory with loving assistance from my wife, Elaine.  Of course, that assistance remains loving as long as I also play music other than polkas, like maybe “Stormy Weather” or “Misty” and songs from the Four Seasons group.

That’s John in his own words. I will add one other thing: he is one of the most service-oriented persons you’re ever likely to encounter. While I forget what my first support issue involved, I haven’t forgotten John’s response. He was right there, responding quickly and helpfully, and he has continued to be “right there” ever since.

Be forwarned, the following is a lengthy interview. I’ve considered breaking it into two installments, but I don’t think it lends itself well to that approach. So I’m leaving it intact, trusting that storm chasers, meteorologists, and anyone interested in cutting-edge weather technology will find this post worth reading in its entirety.

Interview with RAOB Developer John Shewchuk

.
Question: RAOB is incredibly sophisticated weather software. I understand that it is the most powerful of its kind in the world—true? What is your background that equipped you to create it?

John: True in that no other program offers the same degree of functionality and capability in a very user-friendly interface. My twenty-two years in the USAF Weather Service and eight worldwide assignments were fundamental to my knowledge of meteorology. College academics were a good start, but the hands-on, daily routine of creating weather maps and issuing operational forecasts were invaluable to understanding how weather really works.

The majority of my severe weather experience comes from eleven years of multiple assignments at Offutt Air Force Base in Omaha, Nebraska. Other valuable experiences came from duties as a science officer and while stationed at the Typhoon Warning Center in Guam.

But knowledge of meteorology is only part of the story; computer programming is the other part. While at college, I also became fascinated with the power of computer code and spend many hours dabbling with Fortran IV. That interest remained mostly dormant while in the Air Force, as I only used automation as it related to daily duties. But when the personal computer hit the public market, I bought my first PC, the Tandy 1000.

Wow, what power! What a thrill to be able to channel electrons into intelligent processes through computer code. My life had changed dramatically, and my accordion became jealous. I taught myself Visual Basic (since it was similar to Fortran) and began to write small DOS programs. I soon upgraded to a VGA color monitor, a dot-matrix printer, a second floppy disk drive, and more memory. And then, after some deliberation—about two seconds—I went all the way. I broke open my piggy bank and got my first harddrive. Six hundred dollars for a whopping 20 Mb—what a deal! I had now attained nirvana.

I started to write small computer games for my kids and utilities for myself and others. I later began publishing computer and software articles for a PC magazine and won some programming contests. And just to remain in good standing with my accordion, I joined a local community polka band and performed at some fun Octoberfests at California’s Big Bear Lake and other local events. I just love those oompah bands!  I later appeared as the guest PJ (Polka Jockey, versus the more traditional DJ or Disk Jockey) for my wife’s surprise retirement party.  I used the fake beard and mustache to hide my identity since I wasn’t part of the oompah musicians union.

Q: What first inspired you to create RAOB, and when did you begin working on it? How long did it take before the first version was ready for release?

J: While programming games for the kids and utilities for others, I never considered meteorological applications. I instead used the time as a diversion from work—more like relaxation. During this time, I was aware that there were a very few, simple skew-T programs available, but only to large platform government and corporate entities.

But then toward the end of my Air Force career, I heard that one company was creating an advanced interactive weather display and skew-T system for military use for some very big bucks. So then I said, “Hmm, I think I can do a better job for much less.” That was twenty-four years ago.

I soon stopped programming kids’games and started the slow and systematic construction of a skew-T program. Remember, this was all off-duty time, during nights and weekends, and was still in the good old DOS days. My goal was never to market the program, but only to use it as my personal analysis tool, since after military retirement, I planned to use the program to help me with my intended weather consulting business.

In the end, that consulting business never amounted to much. However, soon after beginning the skew-T project, I met Richard Cale at a local American Meteorological Society monthly meeting. Richard (now deceased) had a very successful weather consulting business and helped me obtain my license as a Certified Consulting Meteorologist.

More importantly, for the previous ten years, Richard had been developing advanced upper-air applications on his hand-held, programmable Texas Instrument calculator (a TI-59) while tediously hand-plotting skew-T diagrams.  Within twenty-four hours we met again and began a wonderful collaboration on the skew-T project. In return for access to his analysis notes and algorithms, I gave him exclusive use of the developing skew-T program, now called RAOB.

Over the next several months, RAOB developed into a functional skew-T program that could accurately process and plot sounding data using a simple user format.  At Richard’s insistence, I added graphic interactive capabilities, which made RAOB a powerful data interrogation tool. These interactive capabilities, such as click-and-drag and other graphic editing features, made RAOB ideal for atmospheric research and forensic applications—perfect for a consulting meteorologist or anyone needing fast and accurate answers to “what if” questions.

Richard was delighted, as RAOB significantly improved his capabilities and productivity. And I was happy to now have a functioning skew-T program. However, it was of no use to me in my now-struggling weather consulting business, which mainly consisted of weather-related slip-and-fall and property damage cases. So, in order to pay the bills, I had to take a full-time salaried day job as a database manager. It was not a weather job, but it at least allowed me to stay current in the field of automation.

Just when I thought my weather career was nearing its end, Richard and some other friends suggested that I try selling RAOB, especially since Internet marketing and webmail were rapidly evolving at that time. In 1997, nearly ten years after the program’s inception, I sold the first RAOB (DOS) program. RAOB had transitioned from a hobby to a business.

After five more years, I converted RAOB from a DOS program to a Windows-based application. I am now retired from my day job and work full-time on the RAOB program—finally.

Q: Who are some of your customers, and what are some of the various, perhaps unique, ways in which they use RAOB?

J: RAOB customers are worldwide and are in sixty-four countries (that I know of). I am pleased to say that RAOB is used by the NTSB, NASA, EPA, over 110 universities and many high schools, over 450 TV weather stations, many NWS offices, several US and foreign military services, and other numerous interests from industry, commerce, and public safety.

Special applications include the monitoring of high-value properties such as airports, where RAOB automatically downloads new data, updates various diagram displays, and produces alert notifications of everything from low-level wind shear to fog threats. Competitive soaring pilots also like RAOB because it can identify the altitude, wavelength, and vertical displacement of mountain waves, which are critical during long-distance racing. Other clients use RAOB for detailed analyses of freezing levels, frontal zones, and inversions in the application of cloud seeding for hail suppression purposes. Due to its unique, high-resolution, interactive capabilities, RAOB is the perfect tool for educational and research purposes, both private and government. And storm chasers are always asking for new indices and parameters, which I add at every opportunity.

Q: Storm chasers have various options for obtaining free forecast soundings, two popular ones being TwisterData and Earl Barker. BufKit obviously offers an amazing array of features. What are some advantages of RAOB that set it apart, and that chasers might particularly value?

J: RAOB has five unique advantages over the above free sources of sounding data: (1) RAOB can automatically detect and analyze over forty-five different sounding data formats. New decoders are constantly being added to RAOB while the older ones are kept up to date. For those formats not yet automatically decoded, the user can manually input sounding data into RAOB’s two different data editors. With these flexible input options, RAOB can process any sounding data.

(2) RAOB allows the experienced user to graphically adjust, or edit, any sounding data point—temperature, dewpoint, and wind—and watch the resulting parameter listings and diagrams instantly update on the screen. This can be done on the sounding skew-T diagrams and hodographs.

There is also a special DALR (dry adiabatic lapse rate) function that can automatically adjust the lower atmosphere to simulate heating of the boundary layer, which is a critical parameter in severe weather analyses. These graphic adjustment capabilities give RAOB users a powerful “what if” tool.

(3) While many sources of gridded weather maps and associated forecast soundings are available via the Internet, they lag the availability of the original soundings by a few hours depending on forecast module and source. RAOB, on the other hand, can immediately process the observed sounding file (as available from the Internet or otherwise) and provide a fast, first look at the atmosphere. If RAOB has access to the Internet, the new soundings can be automatically downloaded and processed, depending on data source availability. Automatic, configurable alerts (visual and audible) are also available.

(4) Since most of us live and work between those widely spaced rawinsonde observing sites, RAOB fills the gap with its interpolation function, which can create a complete sounding between any two or any group of soundings. Then, once you have the sounding you need, RAOB can turn that profile into a short-term forecast. If upwind soundings are available, RAOB can automatically use those upwind soundings for time/height advection during forecast creation. If there are no upwind soundings available, RAOB can still create a forecast sounding using classic thermal wind theory logic. RAOB can forecast any sounding. No other skew-T program can perform these functions.

(5) RAOB’s unique severe weather display options make it ideal for those needing fast, accurate storm potential information. Diagrams and text displays can be individually configured to meet user needs. More importantly, individual index and parameter thresholds can be configured to local and seasonal conditions. For example, CAPE thresholds can be adjusted for low, moderate, and severe categories. Theses categories can then be displayed via user-defined colors. The Severe Weather Parameter Table contains forty-eight severe weather parameters that can be configured, which are then automatically consolidated into a simple graphic display for fast analyses.  

Q: Bearing in mind that most chasers operate on a tight budget, what advice would you offer someone who is thinking about purchasing RAOB? Which modules will be most helpful, and why?

J: Tight budgets are getting even tighter these days and that’s why there is now the new RAOB Lite program. It lists for $50.00 and lasts much longer than light beer. You buy it, you own it. You get free technical support, a free upgrade to the next release, and discounts thereafter. The Lite program contains the two most popular data decoders: WMO and BUFKIT. It does not contain the above, advanced interactive features, but it does contain the multi-sounding scanner screen and provides all the essential graphic and text displays for severe weather detection.

If more detail and capability are needed, then an upgrade to the RAOB Basic program is the next step. This gives access to the SHARP, UWYO, and CSV decoders plus many more graphic and text configuration options. Once you have the RAOB Basic program, then any other optional program module can be added. Without a doubt, the most popular optional module is the Analytic module. It provides the advanced severe weather display and text options in addition to many other features.

For those more advanced users, the Interactive and Hodograph module is a must. This turns RAOB into a powerful diagnostic tool. Its interactive capabilities let the user measure the sounding’s “sensitivity” to change. Just the slightest change in surface temperature or dewpoint can make a significant change in the commonly used severe weather indices, such as CAPE, LI, and so forth. Most people use these parameters at first sight; they don’t consider, “What if the surface temperature increased by just one degree?” The results can be dramatic. While sounding sensitivity is very important for lengthy forensic studies, it can also be very useful for quickly evaluating the storm potential of one sounding versus another. Note that this module also contains an advanced hodograph screen which provides detailed analyses of storm motion and related wind shear data.

RAOB has many other optional program modules, each of which is suited for more advanced and special needs. However, one other module that is also useful to storm chasers is the Cross-Section module, which can also produce time-sections of multi-sounding forecast files. One important feature of this module is its meteogram display, which plots the trends of key severe weather indices over the forecast time period.

Q: What advances do you envision for RAOB in the future—say, within the next five years? Any new modules, new capabilities, or perhaps new partnerships in the works?

J: The RAOB factory now operates seven days a week, except for an occasional polka or waltz. Several projects are under construction while others anxiously sit on a prioritized to-do list.

Coming with the next new RAOB release this fall will be the biggest program enhancement since RAOB’s conversion from DOS to Windows. You’re hearing it first right here. The announcement was originally planned for a future American Meteorological Society magazine ad, but the prototype is ahead of schedule and can now be made public. This enhancement is not a new module, but a new screen called the Custom View display. It will be accessible for those with the Basic program at no additional cost.

The Custom View will permit the user to design a personal display screen. You will be able to position and size any combination of sounding and cross-section diagrams for synchronized data displays. Sounding diagrams include skew-T, hodograph, mountain-wave, and soundingram images. The first edition of this screen will only allow placement of graphic diagrams, but later editions will also include text and image objects.

The Custom View screen will satisfy several customer requests at the same time.  It will also be very useful for those with unique wide-screen and vertical-screen monitors. Diagram configuration options will jump from the current 200 or so graphic options to infinite possibilities.

The next major enhancement will be in the area of real-time data processing, especially for non-traditional soundings. These soundings include radiometric, acoustic, sodar, and lidar soundings, which are all becoming more available as these technologies rapidly develop. Although these non-traditional soundings only measure the lower atmosphere, they produce sounding profiles every few minutes or even seconds. This is the wave of the future for weather soundings and will transform how we see the atmosphere, just as Doppler technology accelerated weather radar advances. This data will become absolutely essential to storm chasers—not to mention everyone else.

Beyond these ongoing and planned projects, there are many others on the to-do list, while still others are in the discussion phase. As always, RAOB development responds to customer requests. The more requests received for a particular feature, the faster it becomes reality. New data decoders have the highest priority, since without the ability to ingest and process the data, all else is irrelevant. So, if anyone has a new data or a new need, just contact RAOB.com and let’s talk about it.

Q: Do you chase storms yourself, or was there ever a time in your life when you did?

J: I did get out a few times, but without much success. While stationed at March Air Force Base in southern California, I saw several large dust devils, but they were in hot, dry weather. However, while stationed at my first Air Force job at Offutt AFB in Nebraska, I saw something unusual. At that time I was living in a trailer on a hill—perfect for severe weather monitoring. I saw a pre-tornadic collar or wall cloud. It was large, slowly rotating, and composed of very dark green and blackish clouds.

What an incredible sight! And it was headed toward Omaha. I would have hopped in the car and gone for the chase, but I had to get ready for my weather forecast shift at Offutt AFB. I later found out that an F4 tornado developed and ripped through west-central sections of Omaha on May 6, 1975.

Q: What is your favorite kind of weather? What are some aspects of weather that particularly fascinate you or that you simply enjoy?

J: That’s easy—the awesome stuff. Anything that requires a warning gets my attention. While tornado forecasting is challenging, I found typhoon forecasting particularly exciting. I spent three years on Guam as a typhoon duty officer and loved every minute of it—but that’s another story. Typhoons and hurricanes are the king of the hill when it comes to weather phenomena. They even spawn tornados. Regarding a more subtle, weather-related event, I’m still trying to get my first glimpse of the elusive “green flash.”

———————–

There you have it: RAOB as discussed by its inventor. If this post has a somewhat commercial tone to it, take it in stride. RAOB is John’s business, and obviously he’d like to sell his product. But it’s an absolutely amazing product because it began, and continues, first and foremost as one man’s passion. Having used it for a couple years, I wanted to find out more about its development and its developer and offer my storm chasing and weather readers an article that would be both interesting and useful. The initiative has been my own, and I’ve made no money out of the effort.

While links aplenty have been furnished above, I’ll conclude with one last, handy link to the RAOB homepage in case you’d like to find out more.

What Do You Need to Chase Storms?

“How do I become a storm chaser?” If you’ve been asking that question, this post is for you. I write it with some reservation, knowing that there are people more qualified than I to address the topic. That being said, I’ve been chasing storms with some modicum of success long enough now that I’m confident my insights can have value for those who wonder what it takes to get started.

What do you need in order to chase storms? I’ve seen some lengthy lists developed in response to that question. The input is good, but it can overcomplicate matters, and too much of it all at once can be daunting. If you focus on the word “need,” the answer is much simpler. That’s my approach here: strip it down to the basics, then build from there.

The Foundational Stuff

Here, in my opinion, are the few things that a storm chaser cannot do without:

◊ A roadworthy vehicle, be it yours or a chase partner’s. By “roadworthy,” I mean one that can successfully manage the terrain you’ll be chasing in. If your territory is the flatlands of Illinois and Indiana, or if you intend to stay on main roads that aren’t likely to run out of pavement, then pretty much any vehicle will serve you. On the other hand, if you plan to chase down west Kansas backroads, then you’d better have four wheel drive and great tires; otherwise, the clay out there will slurp you down and ruin your day.

◊ Road maps. Self-explanatory, I think.

◊ Money. You need gas for the tank, right? And maybe a burger along the way.

◊ Basic knowledge of storm structure. Sure, you can chase storms without knowing anything about their features and behavior. But you can’t chase them safely, and the odds of your chasing them successfully are slim. So learn all you can. West Texas storm chaser Jason Boggs has created an outstanding list of educational resources that you can access as quickly as you can click your mouse. Jason’s list mixes basic and advanced material together without discriminating between them. It’s all good, but you should start with the fundamental stuff that deals with storm structure. Veteran chaser Gene Moore’s material on identifying storm features is a good first bet.

Also, a quick plug for Stormtrack, the online informational clearing house, learning resource, and virtual community for storm chasers worldwide. You’ll learn an awful lot just browsing the forum.

One final word on learning: there’s nothing like a mentor. If you can hook up with a seasoned chaser who’s willing to show you the ropes, grab the chance. You can shorten your learning curve significantly. But if such a person isn’t available to you, don’t let that stop you.

◊ Light bars for your vehicle. Absolutely mandatory. How is the world going to know you’re a storm chaser if your vehicle doesn’t resemble a mobile road block?

JUST KIDDING! Don’t worry about light bars just yet.

That’s it for the essentials. Pretty basic, aren’t they–just you, your vehicle, maps, money, and a bit of knowledge. It really doesn’t take any more than that to intercept storms. The main thing is to get out there and do it.

Assuming that you’ve got the fundamentals in place, let’s look next at a few things that will make your chases more successful and your experiences more rewarding.

Important Tools of the Trade

Can you chase storms without a laptop equipped with radar software and mobile data? Of course you can! Ask any chaser who’s been around ten years or longer and they’ll tell you. When the pioneer chasers began paving the way for the rest of us, they did it without all the trimmings. Even Rain-X wasn’t trademarked until 1972, and David Hoadley was chasing storms long before then.

For that matter, I didn’t have any of the following tools of the trade for many years during my own illustrious ascent as a storm chaser. Of course, I didn’t see any tornadoes, either, so don’t take your cues from me. I will tell you that I had a lot of fun learning the slow, hard way. However, my successes came when I started adding a few resources, concurrent with improving my knowledge of forecasting and storm morphology.

All that to say that while the items below aren’t absolutely indispensable, that doesn’t mean they’re not important. They’re very important, and not many chasers today, including the veterans, chase without them.

◊ Laptop computer. It’s your control center.

◊ Power inverter to power your laptop and charge your cameras.

◊ Radar software. Besides a laptop, this should be your first purchase on the list of storm chasing tools. I recommend GR3, at least to begin with. It’s the one used by most chasers, and for good reason: it’s a fabulous program designed specifically for storm chasing, with incredible functionality and flexibility. Just get it, okay? For $80, trust me, you can’t go wrong. For that matter, you get a free trial period that lets you play with the program for a few weeks before you slap down your money.

◊ USB modem and mobile Internet connection. Your best bet is to purchase a USB modem outright; that way you’re not locked into a 2-year contract, and you can deactivate your account during the off-season instead of continuing to pay for data you’re not using. As for Internet connection, Verizon currently provides the best data coverage nationwide, and a lot of chasers use it. Others prefer Sprint, also a good choice. Where you’ll be chasing is something to consider in making your decision.

◊ Radar data feed for GR3. You can use the free feed that NOAA provides. But a lot of chasers prefer a dedicated feed such as those provided by Allisonhouse and MichiganWxSystem. Priced around $10 a month, such a feed is well worth the money.

Nowadays more chasers are using Android phones with radar apps. Not being the geeky type, and also not having the cash, I haven’t looked into these setups. I like having a large display in front of me anyway instead of a tiny screen, but I’m not knocking those who are working with with handheld units. The point is, however you get it and however you display it, you want good, detailed radar information delivered to you with timely updates.

◊ GPS and mapping software such as De Lorme. You’ll also want a serial port emulator that will allow you to use GPS simultaneously with both your map and your radar.

◊ Rain-X. Worth every dollar it costs, and it doesn’t cost much.

SPC Convective Outlooks link. After all, all your great gear doesn’t amount to squat if you can’t find storms! Since you’re new to storm chasing, chances are you don’t have the knowledge to make your own forecasts. Start acquiring it now, beginning with the Storm Prediction Center’s convective outlooks page. It will do two things for you: 1) show you graphically whether and where storms are expected to fire, and 2) through its detailed forecast discussions, familiarize you with the terminology and thinking that go into severe weather forecasting.

◊ Light bars. Don’t leave home without them. How will drab, ordinary, non-storm-chasing mortals know you’re a storm chaser unless…oh, hey, wait a minute. Sorry, we’re still jumping the gun. Forget I mentioned light bars. You don’t need light bars. Not now, anyway. Patience, patience!

Moving On

◊ Station obs, upper air maps, and other forecasting data. Here’s where it gets fun! Making your own forecasts is what separates the be’s from the wannabe’s, and sooner or later you’ll want to try your hand at it. Luckily for you, a cornucopia of forecasting resources is available to you for free online. So start acquainting yourself with the tools of the trade. Check out the tabs at the top of my Storm Chasing page for starters. Also, take a peek at the resources available on my friend Kurt Hulst’s site, Midwest Chasers.

◊ Anemometers, weather meters, and other gadgets. Once you start chasing, you’ll soon run into vehicles tricked out with various devices useful for personal monitoring of wind speed, wind direction, moisture, barometric pressure, and other localized weather conditions. You don’t need any of this stuff in order to enjoy success chasing storms. But depending on how deep and techy you want to get, you might decide that some of it is for you. Just get it for the right reason: to enhance your chasing, not to impress the world with a mess of whizbangs and dingdongs ornamenting the top of your vehicle.

Me, I like to keep things simple. Nothing about my car shouts “storm chaser,” and the only gadget I use is a Kestrel 4500 hand-held weather meter. It’s a cool little device, a regular Swiss Army Knife filled with all sorts of nifty features that I don’t need. I use it mainly to get local, real-time reads on the dewpoint, temperature, and wind speed, information that I do find very useful.

◊ Camera and/or camcorder. A no-brainer if you want to capture visual images of your chases.

◊ Communication equipment. While it probably goes without saying, you should at least carry a cell phone with you. A lot of chasers are also HAM radio operators, and this spring I’ll be joining their ranks with a hand-held unit of my own. I’ve chased for fifteen years without HAM, but I’ve seen the benefits of having it.

◊ Spotter Network. A service of Allisonhouse, Spotter Network interfaces with your radar software and GPS to show other chasers where you’re at and to show you where everyone else is positioned. More importantly, it allows you to quickly and efficiently submit reports of severe weather online from your location.

◊ “NOW can I have a light bar? Can I? Pleeeeze?”

Oh, good grief. Yes, fine, all right, go, get your precious light bar if you must. Buy seven or eight of the damn things. Pick up a spotlight or two while you’re at it. Perish forbid that you should settle for anything less than the candlepower of a NASA launch pad.

My serious opinion: any gadgets you purchase should have a genuinely practical application. I don’t own a light bar myself because I don’t need one. I’m not trained as a first responder, and in the event of an emergency, my best response normally won’t be to clear the road for myself or alert others to my presence, but to get the heck out of the way of emergency personnel who need to get through.

You, on the other hand, may in fact have medical or emergency training and a legitimate use for a light bar. If so, then get one. If not, what’s the point?

And this leads me to comment on one final, vitally important aspect of storm chasing…

Your Attitude

Even as storm chasing has captivated the public through documentaries and reality TV shows, it has also gotten a black eye in some parts of the country due to the misbehavior of irresponsible yahoos. More of these jokers are surfacing all the time. So let’s be clear: chasing storms does not give you license to act like a self-centered idiot. Use common sense. You don’t own the road, so drive safely and respectfully. If you want to stop and film, find a safe place to pull aside so you don’t impede traffic. Drive at a sane speed that doesn’t endanger others, and bear in mind that hydroplaning is a more serious danger to chasers than tornadoes.

Also, have some respect for people who have been chasing for a while. Some experienced chasers have expressed disgust, anger, and disinclination to continue sharing their knowledge after encountering know-nothing newbies who think they know it all. So remember, as a neophyte you’ll earn respect by showing respect. Humility, a thirst to learn, and passion for the storms will get you places that posturing and arrogance never will.

‘Nuff said. Good luck, stay safe, and have fun.

Preparing for Chase Season 2011

Last night I pulled the trigger on a new Panasonic HDC-TM700 camcorder from B&H. I feel a bit of angst in saying this as I’m not in a position where I can easily afford the $750 this pooch is costing me. But neither can I afford to pass up the opportunity to do some chasing for local media, and I’m hoping that this year will furnish enough action that the camera will pay for itself fairly quickly. The old adage, “It takes money to make money,” applies here.

The Panny is a lot of camcorder for the money, too. It has gotten consistently rave reviews. And my buddy Ben Holcomb, who does some great work, has been absolutely delighted with his TM300, which is the predecessor to the model I’ve ordered.

Besides storm chasing, I can also use the camera to make video clips of my sax playing. That will greatly enhance my ability to publicize myself. So, all things considered, I’m telling myself that I’ve made a good investment at a time when money is tight.

With the new camcorder on the way, a HAM radio license is also in the works. For the past two weeks I’ve been studying using Ham Test Online, and this Friday evening I’ll be heading to the Red Cross building in Grand Rapids to take the test. I don’t know why it has taken me this long. I plunked down my $24.95 for the 2-year study subscription over a year ago, and then I procrastinated and procrastinated. Finally a switch flipped in me, though, and I moved from indifference to saturating myself in the HAM material with nigh-obsessive focus. With added incentive from my friend Duane of a free hand-held unit, I’m ready to rumble this Friday and will soon have a valuable new communication tool for storm chasing this spring.

Still to do: get a dash mount and maybe an el-cheapo, used camcorder to go with it. Register for live chasing with Chaser TV. And that’s about it. At last, after all these years, I’ll finally be equipped with everything I needed to not only chase successfully, but also record my chases with good video and still images.

Now if we can just get some storms!

MetEd: A Fantastic Self-Educational Approach for Learning Weather Forecasting

When I first began turning my lifelong fascination with tornadoes into an active passion for storm chasing over 14 years ago, I started with the essentials of storm structure. Then I began learning such arcane terms as CAPE, shear, dewpoints, helicity, and so forth, over time piecing together how the different ingredients interact. Bit by bit, the alchemy of the atmosphere–depicted by surface maps, forecast models, skew-T/log-P diagrams, hodographs, station obs, satellite, radar, and other mystifying tools of the trade–began to make sense to me. Tremblingly, nervously, with a deep sense of my woeful lack of knowledge, I began to try my hand at forecasting–and darned if I didn’t start to make some good calls.

Slowly I learned, and I’m still learning. There’s so much to know, and I want to know as much as I can in order to more accurately determine whether there will be tornadoes, and where, and at what time, and whether a weather scenario will be significant enough to warrant the long drive from Michigan to wherever the storms will be firing.

I wish I’d had a mentor to help me learn this stuff. Thank goodness for the community on Stormtrack–for the many experienced chasers and meteorologists who have generously answered my questions and shared their knowledge over the years! Fortunately for new chasers, a wealth of educational resources exists today that can make the learning curve quicker and less frustrating.

And that brings me to MetEd

I just completed a MetEd satellite interpretation module on vorticity maximas and comma clouds. The material has both enlightened me and kicked my butt. I’ve learned enough to know that I’ve got a lot to learn, but also enough to make better use of water vapor imagery. Now I’m moving on to vorticity minimas, but after finishing the first module I had to just back away for the evening and take a breather. This stuff may seem simple to some, but it makes me want to find a nice hard surface and bonk my head against it. I get the concepts, but working them out in real-life case studies is something else. What gives me incentive is the payoff of becoming a better forecaster. MetEd offers some fantastic tools for pursuing that goal.

Short of a formal education in meteorology, MetEd online courses are probably the best thing going for those who want to acquire basic forecasting skills or expand the skills they’ve already got. I recommend them highly. A program of UCAR (University Corporation for Atmospheric Research), MetEd is no lightweight survey. It’s a constantly growing and evolving suite of vanguard educational products covering a broad sweep of meteorological topics, and it is used by scores of operational forecasters to help them sharpen their blades. Predictably, some of what it offers is well beyond the grasp of most lay persons. Yet a fair amount is accessible to the motivated self-educator, and well worth the time it takes to absorb the material.

The course I’m working on, Dynamic Feature Identification: The Satellite Palette, is a good example. Its interactive format lets you get your hands dirty with actual application as you learn about vort maxes, vort minimas, comma clouds, deformation zones, blocking patterns, and more. Once I’ve completed the full course, while I’ll assuredly be no expert at interpreting water vapor imagery, I’ll nevertheless have gained some knowledge that will serve me well–stuff I’ll be able to use next spring when Big Weather returns to the Great Plains.

If you want to bone up on weather forecasting of any kind, from severe thunderstorms to winter weather and more, you owe it to yourself to check out MetEd. Do it now and you can thank me later for sending you. MetEd is a great way to hone your skills during the long stretch between now and Storm Season 2011.

Forecast Model Simulations for 1965 Palm Sunday Tornadoes: Part 2

The drive down to the WFO at State College, Pennsylvania, was well worth my while (see my previous post). Operational forecaster and research meteorologist David Beachler was a pleasure to work with–personable, patient, and eager to help me understand the exhaustive forecast simulations he had produced on the 1965 Palm Sunday Tornadoes. Having pored over the data with David, gaining his insights on its strengths and weaknesses, I am now extremely excited about what I’ve got on my hands.

David’s modeling uses the WRF-ARW 40 km. The resolution is too coarse to offer the fine details that the SPC is capable of producing, but it gives an excellent overall feel of what forecasters and storm chasers might see in the models if the Palm Sunday synoptic setup were to unfold today instead of forty-five years ago in 1965.

no images were found

There’s no way I can begin to cover all the material, which in any case I need to sift through in order to put together a reasonably concise and meaningful scenario. But I can at least give you a sample of some of the stuff I’ve got to work with. Click on the following images to enlarge them.

First, here is a hand analysis of the kind that is accessible to anyone through NOAA’s historical daily weather maps archives. Besides the surface map for April 11, 1965, you also get the previous day’s surface map, 500 mb chart, and other info. It’s what you would have encountered when you turned to the weather page in the newspaper that morning.

What you would never have seen–because parameters such as CAPE, CIN, helicity, and so on didn’t exist back then, and because even if they had existed, the forecast models which could have depicted them were still years down the road–is this map showing SBCAPE and low-level shear.

The map is for 2200Z, or 6 p.m. EST–roughly the time at which tornadoes began moving through northern Indiana.

It gets even better. Here is a model sounding for KGRR, also at 2200Z, using WRF-ARW Bufkit data. The skew-T and hodograph depict the conditions that were shaping up to produce the F4 Alpine Avenue tornado that formed

around 6:50 p.m., as well as other tornadoes in west and southwest Michigan that day. The helicity is impressive–and look at those winds! Forty knots at 850 millibars is no mere puff of air.

What really excites me is that, using RAOB’s cross-section feature, I should be able to reconstruct a vertical profile of the atmosphere for the entire outbreak area. I’m not sure how deeply I want to go with that, but I have the capacity.

Bear in mind that I’m just showing a couple of representative glimpses derived from a 00Z, day-one model initiation. In fact, David provided me with a range of initiation times that allows me to get a good sense of how the maps might have progressed from several days prior to the actual tornado outbreak.

In practical terms, the maps and model sounding data I’ve got correlate to the NAM. They’re not the NAM, but for storm chasers who typically work with the GFS, ECMWF, GEM, NAM, and RUC, what you see here is probably closest to what you’d find using the North American Mesoscale Model.

That’s all for now. This has been a time-consuming post, and at 2:30 in the afternoon, I need to pull away from it so I can bathe and eat. I didn’t arrive home until 3:00 a.m., so it’s time for this road warrior to reset his time clock and get on with the rest of life.

Forecast Model Simulations for 1965 Palm Sunday Tornadoes: Part 1

Today I’m making the trip to State College, Pennsylvania, where I’ll be overnighting and then meeting tomorrow with operational and research meteorologist David Beachler at the CCX National Weather Service office.

Earlier this year–thanks to John Laurens at KGRR, who contacted him on my behalf–David took such forecasting data as exists on the 1965 Palm Sunday Tornadoes and ran it through a computer. (That’s putting it quite simply, I’m sure.) The result is a veritable blizzard of hourly model simulations which I’m hoping to narrow down to something that can give me new insights into the second worst Great Lakes/Midwest tornado outbreak of modern times. If all goes well, one of the results well be an engaging scenario for the storm chasing community.

Of course, a project of this nature will take some refining. The first hurdle is my own ignorance as a non-meteorologist. It’s one thing for a layman like me to use forecast models in identifying target areas for storm chases; it’s another thing to understand the whys and wherefores of those models.

A second challenge is to sift through the accuracy of the data, since we’re talking about a massive amount of extrapolation from a paucity of decades-old source material; and a third is to distill the immensity of info that David has provided into a reasonably straightforward, meaningful synopsis.

What I’m hoping for, in the end, is a series of surface and upper-air charts that can answer the question, “If the same synoptic conditions that produced the Palm Sunday Tornadoes unfolded today, what might we see in the models from a few days out until the time when tornadoes started dropping?”

This project has been in the wings for a while as part of a larger project which I’m keeping mum about for now. I want to get this part taken care of first, and I’m excited that I’m finally getting to meet with David and go over the data with him, so I can better understand how to interpret it and narrow down a selection from it that will be most useful. I’m extremely appreciative of David’s work, and his willingness to help me sift through it.

Gotta go. I need to hit the road in a couple hours. Here’s hoping for good driving.

New High-Resolution Level 3 Radar Coming in February

Last night Grand Rapids got its first snowfall, and this morning I switched the color tables on GR3 and GR2 to winter mode.

Ugh. I suppose that blue, pink, and purple are going to rule for the next four months. I much prefer plenty of yellow, orange, and red, at least when it comes to radar displays, but we’re at that time of year when those colors aren’t likely to be very meaningful, El Nino or no El Nino.

While switching color tables is relevant to me as a Michigan resident who’s bracing for the winter, it’s nothing compared to the changes coming down the pike for GR3 and other level 3 data users in February. Here’s a message that Gilbert Sebenste of Allisonhouse, a well-known private supplier of raw radar data, posted in the AH and Stormtrack forums:

We have just been informed by the National Weather Service that starting in February 2010, and lasting through April, 2010…the National Weather Service will add higher resolution Level3 radar data products, replacing quite a few of the ones you use right now. The legacy products will continue to be sent for 6 months after all of the replacement products have been added, and will be discontinued on December 1, 2010.

What it all means in a nutshell is this:

1. Resolution will increase
2. The number of reflectivity levels will increase to 256 (meaning you will need to have 256 colors in your color palette to display all the intensity levels)
3. The volume of the files will double, on average
4. The Level3 format will change
5. It will be completed by the end of March, 2010…with legacy products ending 12/1/2010.

Allisonhouse will be working closely with its software partners to provide a seamless as possible transition to the newer and better products upon receipt of transmission from the National Weather Service, and we will provide you with more information as it becomes available.

Wow. Now those, folks, are changes, and it looks like they’ll be here right in time for storm season 2010. High-res level 3–imagine that! My one issue with level 3 has been its coarseness, but that problem is about to be solved. Within a few short months, level 3 data will be coming to us with the same finely shaded resolution as high-res level 2 while remaining a usable product in the field, which is what GR3 is designed for.

Of course, no chaser is going to love the idea of doubling the file sizes. But the improvements look to be awesome, and will give us much more detailed images of storms.

Other Changes on the Way

.

Exciting as the rapidly approaching implementation of high-res level 3 data is, it’s not the only significant development on the horizon. Next year will also see a major phasing-in of dual-pole radar to WSR-88D stations throughout the country. And in the private sector, Andrew Revering of Convective Development, Inc., is working on a huge upgrade for F5 Data forecasting software.

In summary, the technical/informational side of storm chasing will be seeing some significant advancements in the coming year. However many of those improvements are ready for next spring’s severe weather season, let’s just hope that the storms themselves put in a decent appearance.