Phil Barone Tenor Saxophone Review

A World-Class Sax for a Working Musician’s Budget

[NOTE: To see photos, click the links starting in the second paragraph. For whatever reason, I can’t embed images properly in this post.]

This is twice now that I’ve bought a saxophone online, sight unseen, from Phil Barone and twice that I’ve been delighted. Glowing reviews were part of what informed me when I ordered my tenor from Phil a year ago in November; the rest was previous experience. Three years prior I had purchased one of his soprano saxes and was impressed by its quality. I never thought I’d be able to afford another soprano the caliber of the Yamaha purple-label YSS-62 I had owned since the 1980s and was forced to sell in 2016. But the soprano I bought from Phil actually surpasses that sax, and for half of what I could have expected to pay. You can read my review of it here.

Phil offers two tenor models, classic and vintage, in a variety of finishes. Since a number of reviewers likened the classic version to the celebrated Selmer Mark VI, that’s what I chose. Not that I have any experience with the Mark VI; I know it solely by its reputation. The only tenor I’ve ever owned priorly is an ancient Conn with a huge tone but a clunky mechanism, which I put in mothballs long ago after a guy I lent it to returned it unplayable. So while I’ve read of players who sold their Selmers, Yamahas, and other high-profile horns after purchasing their Barone, I can’t make any comparisons. I can only say what I’ve already said: I love this tenor. And I can certainly tell you why.

START WITH THE SOUND

Phil’s saxophones come with two mouthpieces. One is the stock mouthpiece supplied, presumably, by his manufacturer in Taiwan. The other is one of Phil’s own custom hard-rubber mouthpieces, a $250 value in itself.[1] At the time of my purchase last year, Phil had no mouthpieces in stock and was in fact in the process of folding his business—a decision which, thankfully, he has since rescinded. But not to worry, Phil told me. He’d craft me a mouthpiece; just be patient. So the horn arrived with only the stock mouthpiece and a promise which, while it took a little time, Phil delivered on. Meanwhile, wanting to play the horn and being skeptical of stock mouthpieces, I shelled out thirty bucks for a Yamaha 4C to tide me over. It served, but it was far from ideal.

Then one day I opened my mailbox, and there it was—a brand-new New York #7 mouthpiece, shipped in a sturdy plastic protective case. After determining that numbers 3½ and 3 Java Green reeds were too stiff a matchup, I picked up a box of 2½s, slapped one on the piece, blew . . . and oh my gosh. The response. The sound. The bottom notes, warm, resonant, and effortless. The mid-range, full and consistent. The upper notes, crisp, with the edge I’d hoped for. The overall intonation, great. WOW! With my optimal mouthpiece/reed combination finally in place, the horn achieved its potential, and I was blown away.

Now, if I sound a bit effusive, remember, I was, and still am, new to playing tenor sax. One thing, however, was immediately apparent to me, and that was, I had landed a quality instrument. Phil’s goal is to make world-class saxophones available to players who don’t have a world-class budget. He accomplishes this by selling direct-to-consumer, eschewing retail markups and advertising costs. When you order a Barone saxophone, you deal with Phil in person. You talk, he listens, he advises, and he takes pride in giving you a good, a really good, deal.

I’ll add that a while later I also had the good fortune to obtain an older metal piece of Phil’s from my friend Jeff Dowell. Jeff is an unalloyed and persuasive Barone evangelist who owns several of Phil’s saxes, including a bari, and his enthusiasm for them factored into my earlier purchase of my soprano. A few months ago Jeff offered to sell me a Barone #8 tenor mouthpiece. It didn’t resemble anything in Phil’s present lineup, and it showed the signs of wear one could expect, but it passed the pop test just fine. I tried it for a couple weeks, liked its extra edginess and effortless response, and bought it. I now have two of Phil’s mouthpieces. Which do I like best? The one I’m playing; it depends on my mood.

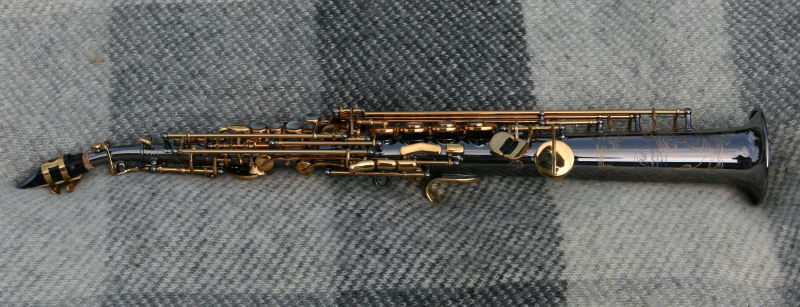
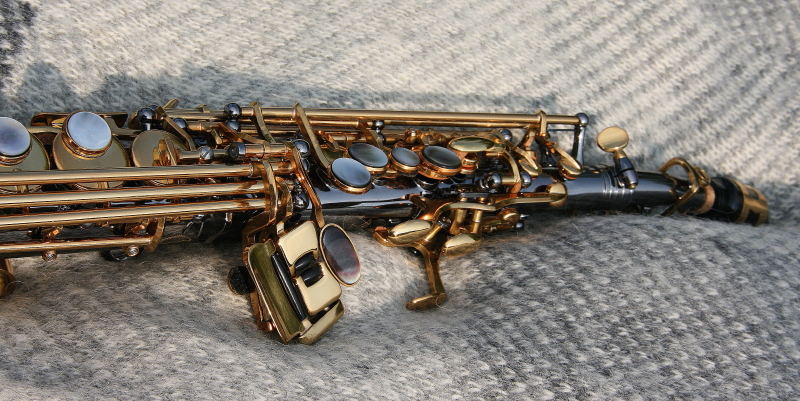
SILKY-SMOOTH MECHANISM AND BEAUTIFUL APPEARANCE

My hands aren’t huge, just an average sort of big, with long fingers. The sax’s ergonomics feel custom made for me. The keys lie comfortably and precisely under my fingers. In particular, the linked low-register plates are remarkably nimble, much easier to get around on than I’m used to with my beloved Conn 6M alto. Maybe that’s also a trait of the Mark VI, to which, as I’ve mentioned, this horn has been favorably compared. Whatever the case, I find myself loving to dip into the bottom end. That’s something new for me—not that I’m averse to prowling around there on my other horns, but this one puts out the red carpet for my left pinky.

There’s a lot of metal in this sax, and I like that. My Conn alto is the same way; there’s a feeling of solidity to it that makes lighter horns feel flimsy to me. That’s not a criticism of other saxes, just my subjective impression, but I think the extra brass in both instruments surely contributes to their sound.

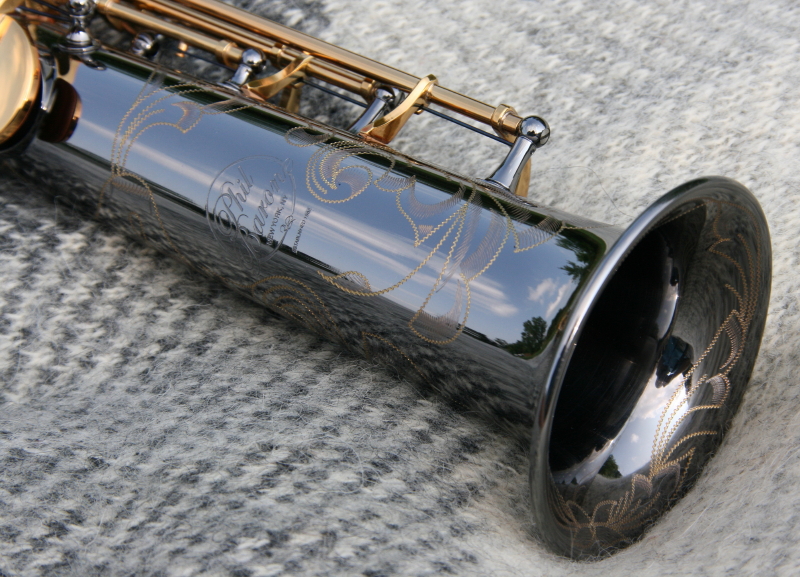
On top of that, this tenor is gorgeous. My soprano has a black nickel plating with gold engraving, but for whatever reason, I felt drawn to the vintage bare brass for my tenor. Something about the richly patterned raw metal with its antique-looking patina attracted me more than a shiny finish. There’s an almost iridescent luster to it that’s quite lovely. One caveat: the bare brass requires conscientious care to avoid spotting, more so than with plating. If you order this finish, make sure you wipe it down with a soft cloth after each use to remove moisture and the acid left by your hands. I suppose that’s just common sense, but I learned the importance of good horn hygiene by failing to practice it until my negligence began to show. A friend of mine with long experience in metalworking advised me to treat the horn with Renaissance Wax. I did so with all my saxes, and I’m now consistent about cleaning their interiors and wiping their surfaces when I’m done playing them.

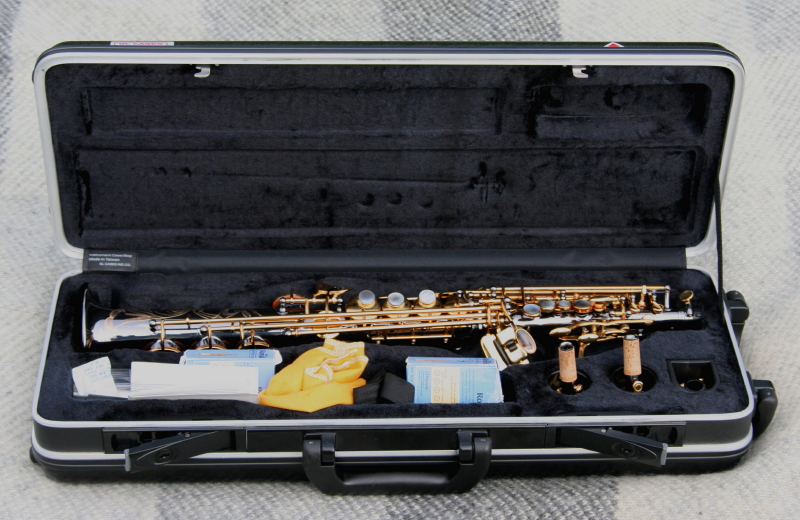
RUGGED AND ATTRACTIVE CASE

After looking at saxophone cases online, I’m struck by the range of prices. You can purchase a tenor case for less than $100 or more than $600. A reasonable starting price for a decent case seems to be around $150. The case my tenor came in—a tough, well-made black ABS hardshell with a contoured interior—compares favorably with the BAM Cabine case, though it’s not sculpted like the BAM. The Cabine sells for around $430; Phil’s site doesn’t state the value of his case, but I’d imagine $300 is a safe and probably conservative bet.

The sax fits in the case snugly—no jostling around—and four latches ensure tight and secure closure. When you first open the case upon receiving your shipment, you’ll find that the saxophone’s keys are all firmly clamped in place to guarantee the pads stay properly seated and the mechanisms remain unaffected by shipping and handling.

Look inside the small compartment at the bottom of the case and you’ll find

  • two mouthpieces, as mentioned earlier: the stock piece and the Barone hard-rubber mouthpiece of your choice
  • a soft cloth for wiping down your horn
  • a shoulder strap for easy, hands-free carrying
  • a padded neckstrap

There are limitations to what the compartment will accommodate, but it holds everything I need: a box of reeds and a reed holder, my two Barone mouthpieces, cork grease, and cleaning cloths for the insides of the neck and sax body. I replaced the neckstrap that came with the horn with a Neotech, which I put in the bell of the horn, and I’ve taken to placing the wipe-down cloth on top of it, though it fits just fine in the compartment.

SUMMING IT UP

I’ve written this review on my own initiative, unsolicited and uncompensated by Phil Barone. My motive is simple: to provide a service to you, my readers, and to give an attaboy to Phil, who surely deserves one.

There are plenty of great saxophones available today, and you can spend as much as you want to obtain one. But you don’t have to kill your budget to get a killer horn. Phil Barone’s mission, as stated on his website’s About page, is to provide players like me with “a professional quality saxophone priced for the student; an instrument that doesn’t just rival the sound of more expensive brands, but out-plays them time and time again.”

Again, I have no grounds for comparing my Barone tenor with other saxophones, but there are scores of endorsements to confirm that Phil’s product lives up to his words. The one thing I can attest to myself is what I’ve already said twice, and three is the charm: I’m in love with this horn.


[1] Your choice of tip opening and either Vintage or SoundMaster mouthpiece.

My New Phil Barone Soprano Saxophone: Wow!

I. LOVE. My new Phil Barone soprano saxophone!

I mean, I seriously dig this horn.

When I sold my vintage Yamaha YSS 62 “Purple Label” a couple years ago, I went into a period of minor mourning. But the tax man required money, and for as long as I had owned the horn–since the mid 1980s–I hadn’t played it much. Practicality won out; the sax went on eBay and got snapped up.

I doubted I’d ever be able to afford another soprano sax of its quality, even used.

The loss became more apparent as the band I play in, My Thin Place (MTP), has prioritized ECM-style tunes that call for the soprano sound. I’m primarily an alto man, and MTP plays plenty of tunes for which alto is the right voice. But when it comes to our originals and numbers like Oregon’s “1,000 Kilometers” and John Abercrombie’s “Timeless,” the soprano is the better fit–in some cases, the only fit. So now what?

Enter–and huge thanks to–my friend and fellow saxophonist Michael Doyle (Evidence; Big Band Nouveau). Recognizing my need to supply the appropriate voice for MTP, he volunteered his Mark VI. “Hang onto it,” he told me. “Just get it to me when I need it.” That was way beyond gracious of Mike, and it was our arrangement for a year or more.

But realistically, I needed a horn of my own. I just didn’t have the money. Self-employment as an editor and writer is a roller coaster, and when the checks come in, they’re usually spoken for. When I felt I could responsibly purchase another horn, I would do so. But that time wasn’t now, and I didn’t know when it would be.

A NAMELESS BENEFACTOR AND A GENEROUS GIFT

Then one evening, at my monthly Sandy Point Beach House gig with MTP, my friend Dave DeVos, the bassist and band leader, told me, “Someone wants to buy you a soprano saxophone. They prefer to remain unknown. How much would a new horn cost?”

Well, that was a question I hadn’t considered lately.

A nameless benefactor wanted to buy me a horn? Really?

Yes, said Dave. West Michigan has its share of arts patrons, and he had approached one of them on my behalf. So, how much?

Whoever it was that was being so gracious toward me, I didn’t want to overreach on his or her generosity. I named an amount: two thousand dollars–hesitantly, because it seemed like an awful lot of money. It was an awful lot of money. But in the world of saxophones, I believed it was practical yet conservative. Then I started shopping online.

A QUEST FOR VALUE

Ouch! Man, those little stinkers are pricey! Had I underestimated? True, you can buy a Chinese horn for a couple hundred bucks, but do you really want to hang your sound on such an instrument, particularly when it’s going to play a defining role in the band?

Two grand, on the other hand, ought to buy me something decent. Maybe not in the same league as the vintage Yamaha I had parted with, but certainly a good horn of a quality one could count on. I just needed to ask the Lord to guide me to it, and I needed to do my homework.

So I dug more deeply. And I began to read glowing accounts of Phil Barone saxophones. Phil, a professional saxophonist in New York, aims to provide pro-quality saxophones at an affordable price for guys like me who can’t afford to slap down $4,000 or more for a new Yamaha, Selmer, Cannonball, or Yanigasawa. By skipping the retailers and selling direct to consumer, Phil is able to offer his saxophones at substantial savings. His website says, “When you order a Phil Barone saxophone, you’re ordering direct from the maker, who doesn’t spend a lot of money or time on expensive ad campaigns or marketing. Great reviews and word of mouth works just fine for Phil Barone. The result is a professional quality saxophone priced for the student; an instrument that doesn’t just rival the sound of more expensive brands but out-plays them time and time again.”

All fine and well–but really? Were the horns as good as all that?

Based on what I read on Sax on the Web and elsewhere, player after player seemed to think so. The reviews weren’t merely positive–they were consistently rave. Saxophonists were loving these horns, preferring them even over their Yamahas and Selmers. I checked out some YouTube demonstrations and was impressed. The intonation–an obvious concern with soprano saxophones–was good, and the sound seemed clear and consistent.

Given a reasonable trial period, what did I have to lose? I ordered a nickel-plated model and eagerly awaited its arrival.

A DELIGHT TO LOOK AT, A JOY TO PLAY

I was in the throes of a terrible cold when the saxophone arrived, so I wasn’t in shape to take it for a test flight immediately. I was barely up to feeling excited–but excited I was, nevertheless. I unboxed the new arrival and, with some trepidation about what I would find, opened the sturdy black hardshell case.

The horn was gorgeous.

It was also well packaged, with pads and keys clamped snugly and all separate pieces wrapped in plastic. Those included, besides the main saxophone body, both a curved and a straight neck, a neckstrap, my choice of one of Phil’s $200 mouthpieces (included in the purchase price), and a basic ligature.

Removing the plastic, I inspected the instrument visually. The finish was flawless–not a rough patch or defect anywhere that I could see. Just sumptuous gold engraving against a smooth, silvery dark nickel lacquer on a sturdily built instrument. My gosh. If this horn’s sound and performance matched its appearance, then I had just gotten a very sweet deal indeed. I’d have to wait to find out, because physically I just wasn’t up to playing a wind instrument. But so far, visually, this soprano had just taken my breath away.

By the next afternoon I had crossed the hump with the cold, and I could wait no longer. I had to know. Grabbing the new soprano, I headed out to Charlton Park east of town–a riverside location where I love to practice–and I assembled the horn and blew my first notes.

Forty-five minutes later I was on the phone with Phil Barone. I wanted to tell him personally how delighted I was and thank him for making such a marvelous instrument accessible to me.

FOUR MONTHS LATER

That was back in late April. It is now mid August. Having had some time to familiarize myself with this saxophone, I can tell you that I no longer feel the loss of my vintage YSS 62. That was a wonderful soprano saxophone, but this new horn surpasses it. It is everything its maker claims. Its lovely tone is consistent throughout the range of the instrument; it is solidly built, with intuitive ergonomics that allow my fingers to fall naturally in place; it is responsive, mechanically deft, and has excellent intonation. It most certainly plays as beautifully as it looks–and that is saying a mouthful. I am proud to own this horn and very grateful to the person who saw fit to bless me with it.

The new Barone is inspiring me to do something I never did with my old Yamaha: spend serious time practicing the soprano sax, learning its nuances and getting a feel for my sound on it. I’ve come to appreciate how very different in temperament it is from my alto saxophone. My Conn 6M alto is a golden-toned, swashbuckling, exuberant instrument that will take as much air as I can give it, and it resonates in my hands like a living thing. This soprano is a lady with a soft, pretty voice, and she’s at her best when I treat her as such.

Due to its smaller size, the soprano is a more temperamental instrument than the alto and tenor saxophones, and intonation can go out of whack in a hurry. Using new, crisp reeds makes a world of difference for playing in tune, and getting the right mouthpiece/reed setup is crucial. The Barone 7* vintage mouthpiece that came with the horn proved to be too ambitious for me. That was my fault. Barone mouthpieces receive stellar reviews, and this one is what I ordered. But in my ignorance about the soprano, I overestimated what I needed; a smaller tip opening would have served me better. I have yet to try using a softer reed–a #2, possibly even a #1 1/2. I’m not a fan of soft reeds, but I’m still in the learning curve with the new soprano and am game to try different options.

My present mouthpiece/reed setup pairs a considerably more moderate Yamaha 4C mouthpiece with a Rico Royal #3 reed. The sound I get with this combination is clear and consistent, and the intonation is great throughout the range of the horn. Still, it will take some time before I feel confident about what setup I want to settle into. The close tip opening of the 4C is at the opposite end of the spectrum from the wide-open Barone 7*, and I’d like to be able to move a little more air. A half-size stronger reed might be the solution. As well, given the affordability of Yamaha mouthpieces–around thirty bucks a pop–I plan to pick up a 5C and see how it performs. I’ll also replace the cheap ligature with something more refined. And at some point, I’ll make a pilgrimage to one of the saxophone shops in Detroit or Chicago and spend an afternoon trying out pieces. For now, though, the 4C is working well, wonderfully so for the price.

My old Yamaha was a solid-body straight soprano. The new two-piece Barone gives me the option of using either a straight or a curved neck, depending on my mood. I’ve gravitated toward the curved neck. It puts the horn in a more comfortable position . . . which makes it more enjoyable to play . . . which means I practice it more. Indeed, I’ve become a junkie. My beloved Conn 6M alto is probably feeling neglected lately, because the Barone soprano is such a pleasure to play. Moreover, based on the comments I’ve gotten from the guys in the band, it is turning out to be a superb voice for our unit.

GENEROSITY

I wouldn’t own this marvel of a horn were it not for the generosity of three people. One of them I know; one of them I have a feel for; and one of them is a mystery.

To Dave DeVos: Thank you for seeing my need for a soprano of my own, thinking of a solution that never would have occurred to me, and inquiring on my behalf.

To Phil Barone: Thanks for putting such a superb brand-new instrument in my hands at so affordable a price.

Last, but by no means least, to my Unknown Benefactor: Thank you for donating the purchase price of this horn. You sounded no horn of your own in doing so. You just quietly made my world a better place. I hope you’re one who sits often among those who enjoy My Thin Place, and when you hear the soprano, I hope it makes you smile.

In addition–Mike Doyle, thanks so much for generously volunteering the use of your Selmer Mark VI soprano, no strings attached, during the time when I was without. I call that exceptional of you.

Generosity is a beautiful thing, particularly in a culture so focused on self and on getting. In my own life, I’ve found that God rewards generous deeds in the oddest, timeliest, and sometimes most striking ways. I’ve never put stock in the so-called “prosperity gospel”; I don’t believe faith is about sticking a buck in the vending machine and getting ten bucks back. But I do believe “God loves a cheerful giver.” Generosity is in proportion to one’s means, and one of its earmarks is the satisfaction, even the joy, that a generous act releases in the heart of the giver. It’s about the motive. Generosity is its own reward. And yet, God takes it further and honors it in unexpected, practical ways.

Mike, Dave, Phil, and my Anonymous Benefactor: May the Lord honor each of you for your generosity.

SUMMING IT UP

Phil Barone soprano saxophones provide tremendous bang for the buck, even twice the buck. It’s safe to assume the same is true of Barone alto and tenor saxes. If you’re in the market for a new saxophone, you’ll do yourself a great service by looking into Phil Barone horns. Read the reviews. They’re impressive and they’re trustworthy. This post is my own unsolicited and unpaid review, and it’s my pleasure to write it. Phil came across to me as a brisk, down-to-business guy; he isn’t a talker on the phone. But his horns do his talking for him. If you buy one, I’m confident that you, like me, will be delighted.

Book Review: The Scale Omnibus by Francesco Balena

Francesco Balena operates the website Saxopedia, a tremendous resource for saxophonists and jazz musicians of every stripe. If you play the sax—or, for that matter, any instrument—and you are not familiar with Franco’s site, then I highly recommend that once you have finished reading this post, you go directly to Saxopedia and acquaint yourself with it. The exhaustive collection of links to solo transcriptions alone is enough to place Saxopedia in the upper echelon of saxophone resources. But there’s much more besides, and that now includes Francesco’s new masterpiece, The Scale Omnibus: 392 Scales for Instrumentalists, Composers, Vocalists, and Improvisers. The amount of material covered in this 429-page, downloadable book is simply staggering. And it’s free.

Did you get that? Free. In the author’s words, “The primary objective of this book is making in-depth knowledge about scales available to the largest number of people as possible. For this reason The Scale Omnibus is free. Free as a free lunch. No strings attached.” There are a few commonsense stipulations in the use of the material, but the bottom line is that Francesco, in keeping with the spirit of Saxopedia, has created what has got to be the most comprehensive repository of scales ever assembled, and now he is making it available to musicians at no cost whatsoever.

It’s a fantastic accomplishment on Francesco’s part, the fruit of considerable time, research, insight, and plain, solid labor; and it is an equally remarkable gift to jazz musicians in search of fresh ideas for improvisation.

Organization

The Scale Omnibus is well-organized and easy to use. Following a thoughtfully written, insightful introduction, the book plunges directly into the material, beginning with the common major and minor scales and their modes and then progressing, per the table of contents, through

  • Symmetrical Scales
  • Jazz Scales
  • Pentatonic Scales
  • Modal Scales
  • European Scales
  • Asian Scales
  • Indian Scales
  • Miscellaneous Scales

Every scale is allotted its own separate, full page. Scales are presented in ascending form in all twelve keys—with the exception, for obvious reasons, of the chromatic scale—and in descending form as well for a few of the Indian ragas whose ascending and descending forms differ. Each scale is preceded by brief, helpful notes that cover its alternate names, modes, construction, harmonic applications (i.e., which chords it works well with), and in some cases, its country of origin.

Following the presentation of the scales themselves, the book includes four appendices that provide a scale index and scales by name, interval, and chord. The last appendix, Scales by Chord, strikes me as particularly useful, providing a quick match-up of chords with scale options. Many of the options will be familiar to experienced improvisers, but there are surprises. For instance, until a short while ago, I had no idea that the Romanian scale could be used with a minor seventh chord. (For that matter, I had no idea there was such a thing as a Romanian scale.) This particular appendix is by no means exhaustive, given the vast array of possibilities covered by the book, and Franco might consider expanding the list of scale choices in a future edition. However, the amount of time required to do so would no doubt be considerable, and the appendix as it stands is an eminently useful tool, furnishing a greater selection than similar lists such as Jamey Aebersold’s chord/scale syllabus.

About the Scales

The Scales Omnibus gives all scales, both the everyday and the exotic, equal coverage. But while it begins with the major and minor scales all Westerners relate to, whether trained musicians or everyday listeners, it goes far beyond those scales into territory most of us aren’t familiar with. For instance, turning to the first page of the section on Asian scales, I come across something called the Honkoshi scale, which, I am informed, originated in Japan; generates, as its modes, the Raga Hamsa Vinodini, the Raga Manavi, and the Insen scale; and works well with a half-diminished chord. Following it is the Ichikotsucho scale, also known as—are you ready?—the Major-Lydian Mixed, Gregorian 5, Genus Diatonicum Veterum Correctum, Kubilai, Raga Bihag, Raga Gaud Sarang, Raga Hamir Kalyani, Raga Kedar, Raga Yaman Kalyan, and Raga Chayanat. Stick that in your horn and play it (preferably over a Cmaj7 or Cma7#11).

Does this book cover every possible scale under the sun? No. Francesco has screened out scales of fewer than five notes; such scales exist, but when tones become so sparse, the use of the term scale becomes questionable. Also, significantly, the book covers only scales that fit easily within the twelve-tone, well-tempered system. Francesco writes, “Microtonal scales, scales that use just temperament, and scales that use equal temperament obtained by dividing the octave in a different number of intervals—as is the case of some Arabian scales—are not included.”

In Summary

A book so vast in its scope as this can only provide the basic scales and insights on their use. From there, it’s up to you to determine which scales interest you most and develop exercises that will help you master them. No way will you or anyone ever internalize all of them. But even one new scale is a tremendous acquisition for the improvising musician, and to that end, The Scale Omnibus is a treasure trove of possibilities. Franceso could easily ask $25.00 or more for this volume; instead, he’s offering it for free, and in so doing, he has added even more value to an already immensely valuable website for jazz instrumentalists, particularly saxophonists.

A work of such excellence and heart as Francesco’s book, given so generously to others, deserves support, and it is in that spirit that I have written this unpaid and unsolicited review.

Bravissimo, Francesco! You’ve given a gift to musicians everywhere. Thank you.

Maps Coming to RAOB Sounding Software

Welcome to 2014! I’m going to refrain from writing the typical New Year’s Day stuff here, having already shared my greeting and reflections on Facebook. Instead, I want to share  one of the cool new things this New Year has brought in.

For some time now, deep in a hollow tree, John Shewchuk has been hard at work, and now, at last, he has rolled out something that is sure to make your mouth water: worldwide data maps for his RAOB software.

Okay, so it’s not a new cookie and John is not a Keebler elf. What he is, is the creator of the world’s most powerful and versatile atmospheric sounding software, which, thanks to John’s ongoing quest for excellence, keeps getting better all the time.

I am an unabashed RAOB fan, and I’m far from alone. John’s clients, both government and private sector, are legion and worldwide and firm believers in the phenomenal firepower of John’s brainchild. I am probably the humblest and least sophisticated of the bunch, not being a weather researcher or an operational forecaster but merely a layman with an avid interest in storm chasing. I purchased the core software several years ago along with a number of the modules, and I quickly realized that the capabilities of RAOB far outstripped my knowledge of the atmosphere, to say nothing of my technical expertise. I will add that I’ve learned a bit since then, particularly in the first area, thanks in part to RAOB, whose commonsense design has made the meteorological insights that soundings have to reveal easier to access for even a non-tech such as me.

And that underscores what is, in my book, one of RAOB’s most glowing attributes: its ease of use. I don’t have to be a geek in order to make it go. It’s much easier and faster to use than Bufkit, which, though feature-rich and free, I never could figure out. And now, with the addition of worldwide data maps, the RAOB user interface becomes even more intuitive and convenient.

RAOB Map USHere is an example of one of the maps. As you can see from the pulldown menu, there are other options which, altogether, cover the entire globe, including the polar regions. They are the latest improvement to the version 6.5 beta test and apply only to WMO soundings, not forecast soundings such as GFS or NAM. The latest update to the maps completes phase 1 of the mapping project. A recent newsletter stated that “phase 2 will enable creation of cross-sections by just drawing a line across the data maps. ” That will be an immensely useful feature for setting up spatial (versus temporal) cross-sections.

Bottom line: Big kudos and thanks to John–who, by the way, works out of his home in Matamoras, Pennsylvania, not in a hollow tree. Sorry to disillusion you. But if you’re a storm chaser or a weather buff, what he turns out goes far beyond anything the Keebler elves ever dreamed of.

I should add, this is neither a paid nor solicited review. I have written it strictly as a service to fellow storm chasers and because I love John’s work.

F5 Data: A Swiss Army Knife for Storm Chasers Adds Some Superb New Tools

I first began using F5 Data in 2007, and despite its early developmental quirks and my own vast lack of experience at forecasting, I fell in love with it. Storm chaser and program designer Andrew Revering had a solid and unique concept, one that gave me an ample tool for both learning forecasting and chasing storms. In particular, its configurable overlay of RUC maps on top of my GR3 radar images (via Allisonhouse’s data feed) appealed to me. At a glance, I could get a good idea of the kind of environment storms were moving through and into. And I had more than 160 parameters to choose from. I hadn’t an inkling what most of them were for, but they were available to me if ever I learned.

In 2008, Andy made significant upgrades to his product with the addition of color shading and contouring, GFS at 3-hour intervals out to 180 hours, a calculator for instantly converting various units of measurement to other units of measurement ( such as meters per second to knots and miles per hour), and other improvements.  The result not only looked attractive and professional, but it offered more solid bang for the buck–and at a little over $14.00 a month, the bucks were easily affordable.

Map Overlays: An Immensely Useful Feature

500 mb Heights

CONUS view showing 500 mb height contours. Note: Images shown here do not correspond to the text example.

At the same time, my own forecasting skills were slowly improving, and as they did, I came to greatly value another key feature of F5 Data: its ability to layer any of its maps on top of each other. This is a hugely useful feature and one I haven’t seen in any other commonly available forecasting resource that doesn’t require more technical skills than I possess. F5 Data is easy and intuitive to use, and as my knowledge grew, so did my appreciation for its map overlays.

F5 Sample Overlays

CONUS view with shaded surface dewpoints and surface wind barbs added to 500 mb heights contours. Labels for dewpoints have been turned off.

F5 Overlays Zoomed

Same overlays as above zoomed in to selected area.

Say, for instance, I’m looking at the NAM 48-hour forecast for 21Z. I select the 500 mb heights map, choosing the contour setting, and see a trough digging into New Mexico, with diffluence fanning across the Texas/Oklahoma panhandles up into Kansas. How is the boundary layer responding? Switching from contours to shading, I select sea level pressure, and now, superimposed on the H5 heights, I can see a 998 mb low centered in southwest Kansas. Another click adds surface wind barbs, which show a good southeasterly flow toward the low, with an easterly shift across northern Kansas suggesting the location of the warm front. Hmmm, what’s happening with moisture? Deleting the SLP map–I don’t have to, but too many maps creates clutter–I select surface dewpoints. Ah! There’s a nice, broad lobe of 65 degree Tds stretching as far north as Hutchinson, with a dryline dropping south from near Dodge City into Oklahoma and Texas. Another click gives me an overlay of 850 mb dewpoints, revealing that moisture is ample and deep. Still another click shows a 70 knot 500 mb jet core nosing in toward the panhandles.

You get the idea. I can continue to add and subtract maps of all kinds–surface and mixed-layer CAPE, 3 km and 1 km storm-relative helicity, bulk shear, 850 mb wind speed and directional barbs, EHI, STP, moisture convergence, and whatever else I need to satisfy my curiosity about how the system could play out two days hence. I can see at a glance favorable juxtapositions of shear, moisture, lift, and instability per NAM. And I can make similar comparisons with GFS, and on day one, with RAP (which replaced RUC in May 2012).

And Now the Upgrade: Presenting Version 2.6

Everything I’ve written so far has been to set a context for what follows, which is my review of the latest major upgrade to F5 Data. It comess at a time when the number of forecasting products available online has greatly expanded and old standbys have updated in ways that make them marvelously functional. Notably, a number of years ago TwisterData gained rapid and massive acceptance among storm chasers, and it continues to enjoy prominence as a quick, one-stop resource. Like F5 Data, it features GFS, NAM, and RAP, and it also offers point-and-click model soundings, a very handy feature. In 2010, the HRRR brought hourly high-resolution maps to the fray, with its forecast radar images demonstrating considerable accuracy. And the SPC’s Mesoanalysis Graphics, always a stellar chase-day resource, has recently made some dynamite improvements. Today the Internet is a veritable candy store of free forecasting resources.

GR3 with F5 mesoanalysis overlay. This one shows surface and 850 mb Tds and 850 wind barbs. (The blue wind barbs are an Allisonhouse product.)

GR3 with F5 mesoanalysis overlay. This one shows surface and 850 mb dewpoints and 850 mb wind barbs. (The blue METARs are an Allisonhouse product.)

At the same time, F5 Data didn’t seem to be doing much, and while I still resorted to it constantly, I wondered whether Andy had lost his passion and commitment to his product. Most troubling to me, the proprietary mesoanalysis maps which had replaced the RUC maps as GR3 overlays often failed to update in a timely manner, rendering them pointless. Given their potential usefulness in the field–how valuable would it be, for instance, to see at a glance that the storm you’re following is moving into greater instability and bulk shear?–I found this disappointing.

But I no longer have any such concerns. This latest upgrade has rendered F5 Data a powerhouse. All the while, Andy was beavering away in the background, fixing bugs and incorporating various client requests into his own set of huge improvements to his creation. Beginning with the February 1, 2013, release of v. 2.5 and moving in seven-league strides toward the latest version, 2.6.1, these changes have been a long time coming, they reflect a lot of work on Andy’s part, and they have been well worth the wait.

Here’s What Is New

The following will give you a quick idea of the more significant changes:

  • NAVGEM has been added to the F5 suite of forecast models.
  • Users can now draw boundaries, highs, and lows.
  • Users can select increments other than the default by which arrow keys advance forecast hours for the different models
  • The map now offers an experimental curved-Earth projection.
  • Wind barbs at different levels can be overlaid to provide visuals of speed and directional shear.
  • Processing is faster (up to 45 minutes faster with GFS)
  • Text for geographic maps can now be customized.

And yes, the mesoanalysis maps are now on the money. Andy moved them to a faster server, and they now update regularly and consistently, to the point where I plan to display some of them on my site the way I used to do with the F5 Data RUC maps.

All of the above are in addition to the already existing array of features. A few of these include the following:

  • Over 160 parameters, including ones you just don’t find elsewhere, such as the Stensrud Tornado Risk and isentropic surfaces, and also a good number of proprietary products such as the APRWX Tornado Index, APRWX Severe Index, and APRWX Cap.
  • Current conditions plus five forecast models: GFS (out to 384 hours), NAM, RAP, hourly mesoanalysis, and the newly added NAVGEM.
  • Mesoanalysis integration with radar products via Allisonhouse (already described).
  • A point-and-click CONUS grid of forecast soundings.
  • Zoom capabilities that let you zero in on areas of interest. Activate the display of cities and roads and target selection gets that much easier.
  • National satellite (visible, water vapor, and infrared) and base reflectivity radar composites.
  • Fully customizable map overlays (as discussed above).
  • 14 categories of maps organized for particular purposes, including Severe, Tornado, Hurricane, Cold Core, Winter, Lift, Shear, and Moisture. These are fully customizable, and you can create your own categories if you wish.
  • Watch and warning boxes.

To describe all of the features that F5 Data offers would take too much space and isn’t necessary. You can find out more at the F5 Data website, which includes a whole library of video tutorials on what F5 Data is and how to use it.

Better yet, you can download the software (it’s free) and try it out for yourself with 17 free maps.

If there is any downside to the upgraded F5 Data, it is minor and purely personal. I miss the passing of the historical data feature some months prior to the main upgrade. That feature allowed me to request data for past forecast dates and hours so I could study chase setups from years gone by. I wish I still had that option. However, I understand that it needed to go in order for Andy to move ahead with his changes. The feature was peripheral to the purpose of F5 Data, evidently it didn’t get used much, and it’s a small price to pay for the big improvements to this forecasting resource.

One thing Andy might consider for a future update would be to break down SBCAPE and MLCAPE contours into smaller increments. CAPE is displayed by intervals of 100 from 0–500 J/kg, which is great; but from 500 up to 3,000, it jumps by units of 500 J/kg, and from 3,000 on up it moves 1,000 J/kg at a time. Realistically, these are just overviews of instability, and they’re in keeping with how most other forecast resources display CAPE. If you want to get more granular, you can always check out forecast soundings. Still, it’s an opportunity for F5 Data to provide a somewhat more incremental breakdown similar to that of TwisterData.

With these last two comments dispensed of, I highly recommend to you the new and improved F5 Data. It’s easy to use and flexible as all getout, and it puts a squadron of tools at your disposal, all in one eye-pleasing, zoomable interface. Of course, no one forecasting resource covers all the bases, and that is certainly true of F5 Data. But this is nonetheless a fabulous product that offers some unique advantages. These latest changes, including the addition of NAVGEM, the ability to draw boundaries, and mesoanalysis graphics that update regularly to provide the most current information, have taken an already fine resource and made it dramatically more useful.

Bravo, Andrew Revering! You do great work.

This review, by the way, is unsolicited and unpaid-for. I’ve been a fan of F5 Data and of Andy from the start, and I’m pleased to share my thoughts about the latest iteration of a product I’ve used extensively and benefited from for a good number of years.


An Interview with RAOB Developer John Shewchuk

Two of the handier implements in a storm chaser’s forecasting toolkit are the skew-T/log-P and the hodograph. These two charts typically come bundled together, furnishing vertical slices of the upper air that show graphically how the atmosphere is behaving—or, in the case of forecast soundings, is projected to behave—from 100 millibars all the way down to the surface.

If you want to see at a glance how unstable the atmosphere is and how much convective inhibition suppresses that instability, look at a skew-T. If you want to know in what direction and how fast storms are likely to move and how much low-level helicity they’re likely to ingest, consult a hodograph. The skew-T and hodograph, along with a multitude of derived indices that often attend them, provide a wealth of vital information.

Soundings can be obtained from a variety of sources, many of them free. Among those sources, RAOB is in a league of its own. Its website homepage describes it as “the world’s most powerful and innovative sounding software. Automatically decodes data from 45 different formats and plots data on 12 interactive displays including skew-Ts, hodographs, & cross-sections. Produces displays of over 200 atmospheric parameters including icing, turbulence, wind shear, clouds, inversions and more.”

A couple years ago, I purchased the Basic module and several others—the Analytic, the Hodograph and Interactive, the Advanced Cross-Section, and the Special Data Decoders—and thus gained empirical familiarity with the powers of RAOB. It is an amazing program, all the moreso for its ease of use. Yet I have to confess that I’ve only scratched its surface. I simply don’t have the know-how to tap into its full capabilities. The more meteorologically and technically astute a user is, and the deeper one wants to dig into the atmosphere, the more RAOB will deliver.

In this interview, RAOB developer John Shewchuk talks about his brainchild. John presents his bio thus:

My life in three steps: (1) Born at West Point, New York—so I knew I wanted to be a military guy. (2) Started playing the accordion at age eight—because my parents told me to. (3) Got interested in weather during high school—because it fascinated me. Putting the three all together, I went to Penn State for my meteorology degree while playing the “Rain, Rain Polka” at parties for extra income, and I graduated with an ROTC commission in the Air Force. After twenty-two years in the USAF Weather Service, I retired as a lieutenant colonel.

I am now back in my hometown of Matamoras, Pennsylvania, in the house that my grandpa built. Here I operate the RAOB factory with loving assistance from my wife, Elaine.  Of course, that assistance remains loving as long as I also play music other than polkas, like maybe “Stormy Weather” or “Misty” and songs from the Four Seasons group.

That’s John in his own words. I will add one other thing: he is one of the most service-oriented persons you’re ever likely to encounter. While I forget what my first support issue involved, I haven’t forgotten John’s response. He was right there, responding quickly and helpfully, and he has continued to be “right there” ever since.

Be forwarned, the following is a lengthy interview. I’ve considered breaking it into two installments, but I don’t think it lends itself well to that approach. So I’m leaving it intact, trusting that storm chasers, meteorologists, and anyone interested in cutting-edge weather technology will find this post worth reading in its entirety.

Interview with RAOB Developer John Shewchuk

.
Question: RAOB is incredibly sophisticated weather software. I understand that it is the most powerful of its kind in the world—true? What is your background that equipped you to create it?

John: True in that no other program offers the same degree of functionality and capability in a very user-friendly interface. My twenty-two years in the USAF Weather Service and eight worldwide assignments were fundamental to my knowledge of meteorology. College academics were a good start, but the hands-on, daily routine of creating weather maps and issuing operational forecasts were invaluable to understanding how weather really works.

The majority of my severe weather experience comes from eleven years of multiple assignments at Offutt Air Force Base in Omaha, Nebraska. Other valuable experiences came from duties as a science officer and while stationed at the Typhoon Warning Center in Guam.

But knowledge of meteorology is only part of the story; computer programming is the other part. While at college, I also became fascinated with the power of computer code and spend many hours dabbling with Fortran IV. That interest remained mostly dormant while in the Air Force, as I only used automation as it related to daily duties. But when the personal computer hit the public market, I bought my first PC, the Tandy 1000.

Wow, what power! What a thrill to be able to channel electrons into intelligent processes through computer code. My life had changed dramatically, and my accordion became jealous. I taught myself Visual Basic (since it was similar to Fortran) and began to write small DOS programs. I soon upgraded to a VGA color monitor, a dot-matrix printer, a second floppy disk drive, and more memory. And then, after some deliberation—about two seconds—I went all the way. I broke open my piggy bank and got my first harddrive. Six hundred dollars for a whopping 20 Mb—what a deal! I had now attained nirvana.

I started to write small computer games for my kids and utilities for myself and others. I later began publishing computer and software articles for a PC magazine and won some programming contests. And just to remain in good standing with my accordion, I joined a local community polka band and performed at some fun Octoberfests at California’s Big Bear Lake and other local events. I just love those oompah bands!  I later appeared as the guest PJ (Polka Jockey, versus the more traditional DJ or Disk Jockey) for my wife’s surprise retirement party.  I used the fake beard and mustache to hide my identity since I wasn’t part of the oompah musicians union.

Q: What first inspired you to create RAOB, and when did you begin working on it? How long did it take before the first version was ready for release?

J: While programming games for the kids and utilities for others, I never considered meteorological applications. I instead used the time as a diversion from work—more like relaxation. During this time, I was aware that there were a very few, simple skew-T programs available, but only to large platform government and corporate entities.

But then toward the end of my Air Force career, I heard that one company was creating an advanced interactive weather display and skew-T system for military use for some very big bucks. So then I said, “Hmm, I think I can do a better job for much less.” That was twenty-four years ago.

I soon stopped programming kids’games and started the slow and systematic construction of a skew-T program. Remember, this was all off-duty time, during nights and weekends, and was still in the good old DOS days. My goal was never to market the program, but only to use it as my personal analysis tool, since after military retirement, I planned to use the program to help me with my intended weather consulting business.

In the end, that consulting business never amounted to much. However, soon after beginning the skew-T project, I met Richard Cale at a local American Meteorological Society monthly meeting. Richard (now deceased) had a very successful weather consulting business and helped me obtain my license as a Certified Consulting Meteorologist.

More importantly, for the previous ten years, Richard had been developing advanced upper-air applications on his hand-held, programmable Texas Instrument calculator (a TI-59) while tediously hand-plotting skew-T diagrams.  Within twenty-four hours we met again and began a wonderful collaboration on the skew-T project. In return for access to his analysis notes and algorithms, I gave him exclusive use of the developing skew-T program, now called RAOB.

Over the next several months, RAOB developed into a functional skew-T program that could accurately process and plot sounding data using a simple user format.  At Richard’s insistence, I added graphic interactive capabilities, which made RAOB a powerful data interrogation tool. These interactive capabilities, such as click-and-drag and other graphic editing features, made RAOB ideal for atmospheric research and forensic applications—perfect for a consulting meteorologist or anyone needing fast and accurate answers to “what if” questions.

Richard was delighted, as RAOB significantly improved his capabilities and productivity. And I was happy to now have a functioning skew-T program. However, it was of no use to me in my now-struggling weather consulting business, which mainly consisted of weather-related slip-and-fall and property damage cases. So, in order to pay the bills, I had to take a full-time salaried day job as a database manager. It was not a weather job, but it at least allowed me to stay current in the field of automation.

Just when I thought my weather career was nearing its end, Richard and some other friends suggested that I try selling RAOB, especially since Internet marketing and webmail were rapidly evolving at that time. In 1997, nearly ten years after the program’s inception, I sold the first RAOB (DOS) program. RAOB had transitioned from a hobby to a business.

After five more years, I converted RAOB from a DOS program to a Windows-based application. I am now retired from my day job and work full-time on the RAOB program—finally.

Q: Who are some of your customers, and what are some of the various, perhaps unique, ways in which they use RAOB?

J: RAOB customers are worldwide and are in sixty-four countries (that I know of). I am pleased to say that RAOB is used by the NTSB, NASA, EPA, over 110 universities and many high schools, over 450 TV weather stations, many NWS offices, several US and foreign military services, and other numerous interests from industry, commerce, and public safety.

Special applications include the monitoring of high-value properties such as airports, where RAOB automatically downloads new data, updates various diagram displays, and produces alert notifications of everything from low-level wind shear to fog threats. Competitive soaring pilots also like RAOB because it can identify the altitude, wavelength, and vertical displacement of mountain waves, which are critical during long-distance racing. Other clients use RAOB for detailed analyses of freezing levels, frontal zones, and inversions in the application of cloud seeding for hail suppression purposes. Due to its unique, high-resolution, interactive capabilities, RAOB is the perfect tool for educational and research purposes, both private and government. And storm chasers are always asking for new indices and parameters, which I add at every opportunity.

Q: Storm chasers have various options for obtaining free forecast soundings, two popular ones being TwisterData and Earl Barker. BufKit obviously offers an amazing array of features. What are some advantages of RAOB that set it apart, and that chasers might particularly value?

J: RAOB has five unique advantages over the above free sources of sounding data: (1) RAOB can automatically detect and analyze over forty-five different sounding data formats. New decoders are constantly being added to RAOB while the older ones are kept up to date. For those formats not yet automatically decoded, the user can manually input sounding data into RAOB’s two different data editors. With these flexible input options, RAOB can process any sounding data.

(2) RAOB allows the experienced user to graphically adjust, or edit, any sounding data point—temperature, dewpoint, and wind—and watch the resulting parameter listings and diagrams instantly update on the screen. This can be done on the sounding skew-T diagrams and hodographs.

There is also a special DALR (dry adiabatic lapse rate) function that can automatically adjust the lower atmosphere to simulate heating of the boundary layer, which is a critical parameter in severe weather analyses. These graphic adjustment capabilities give RAOB users a powerful “what if” tool.

(3) While many sources of gridded weather maps and associated forecast soundings are available via the Internet, they lag the availability of the original soundings by a few hours depending on forecast module and source. RAOB, on the other hand, can immediately process the observed sounding file (as available from the Internet or otherwise) and provide a fast, first look at the atmosphere. If RAOB has access to the Internet, the new soundings can be automatically downloaded and processed, depending on data source availability. Automatic, configurable alerts (visual and audible) are also available.

(4) Since most of us live and work between those widely spaced rawinsonde observing sites, RAOB fills the gap with its interpolation function, which can create a complete sounding between any two or any group of soundings. Then, once you have the sounding you need, RAOB can turn that profile into a short-term forecast. If upwind soundings are available, RAOB can automatically use those upwind soundings for time/height advection during forecast creation. If there are no upwind soundings available, RAOB can still create a forecast sounding using classic thermal wind theory logic. RAOB can forecast any sounding. No other skew-T program can perform these functions.

(5) RAOB’s unique severe weather display options make it ideal for those needing fast, accurate storm potential information. Diagrams and text displays can be individually configured to meet user needs. More importantly, individual index and parameter thresholds can be configured to local and seasonal conditions. For example, CAPE thresholds can be adjusted for low, moderate, and severe categories. Theses categories can then be displayed via user-defined colors. The Severe Weather Parameter Table contains forty-eight severe weather parameters that can be configured, which are then automatically consolidated into a simple graphic display for fast analyses.  

Q: Bearing in mind that most chasers operate on a tight budget, what advice would you offer someone who is thinking about purchasing RAOB? Which modules will be most helpful, and why?

J: Tight budgets are getting even tighter these days and that’s why there is now the new RAOB Lite program. It lists for $50.00 and lasts much longer than light beer. You buy it, you own it. You get free technical support, a free upgrade to the next release, and discounts thereafter. The Lite program contains the two most popular data decoders: WMO and BUFKIT. It does not contain the above, advanced interactive features, but it does contain the multi-sounding scanner screen and provides all the essential graphic and text displays for severe weather detection.

If more detail and capability are needed, then an upgrade to the RAOB Basic program is the next step. This gives access to the SHARP, UWYO, and CSV decoders plus many more graphic and text configuration options. Once you have the RAOB Basic program, then any other optional program module can be added. Without a doubt, the most popular optional module is the Analytic module. It provides the advanced severe weather display and text options in addition to many other features.

For those more advanced users, the Interactive and Hodograph module is a must. This turns RAOB into a powerful diagnostic tool. Its interactive capabilities let the user measure the sounding’s “sensitivity” to change. Just the slightest change in surface temperature or dewpoint can make a significant change in the commonly used severe weather indices, such as CAPE, LI, and so forth. Most people use these parameters at first sight; they don’t consider, “What if the surface temperature increased by just one degree?” The results can be dramatic. While sounding sensitivity is very important for lengthy forensic studies, it can also be very useful for quickly evaluating the storm potential of one sounding versus another. Note that this module also contains an advanced hodograph screen which provides detailed analyses of storm motion and related wind shear data.

RAOB has many other optional program modules, each of which is suited for more advanced and special needs. However, one other module that is also useful to storm chasers is the Cross-Section module, which can also produce time-sections of multi-sounding forecast files. One important feature of this module is its meteogram display, which plots the trends of key severe weather indices over the forecast time period.

Q: What advances do you envision for RAOB in the future—say, within the next five years? Any new modules, new capabilities, or perhaps new partnerships in the works?

J: The RAOB factory now operates seven days a week, except for an occasional polka or waltz. Several projects are under construction while others anxiously sit on a prioritized to-do list.

Coming with the next new RAOB release this fall will be the biggest program enhancement since RAOB’s conversion from DOS to Windows. You’re hearing it first right here. The announcement was originally planned for a future American Meteorological Society magazine ad, but the prototype is ahead of schedule and can now be made public. This enhancement is not a new module, but a new screen called the Custom View display. It will be accessible for those with the Basic program at no additional cost.

The Custom View will permit the user to design a personal display screen. You will be able to position and size any combination of sounding and cross-section diagrams for synchronized data displays. Sounding diagrams include skew-T, hodograph, mountain-wave, and soundingram images. The first edition of this screen will only allow placement of graphic diagrams, but later editions will also include text and image objects.

The Custom View screen will satisfy several customer requests at the same time.  It will also be very useful for those with unique wide-screen and vertical-screen monitors. Diagram configuration options will jump from the current 200 or so graphic options to infinite possibilities.

The next major enhancement will be in the area of real-time data processing, especially for non-traditional soundings. These soundings include radiometric, acoustic, sodar, and lidar soundings, which are all becoming more available as these technologies rapidly develop. Although these non-traditional soundings only measure the lower atmosphere, they produce sounding profiles every few minutes or even seconds. This is the wave of the future for weather soundings and will transform how we see the atmosphere, just as Doppler technology accelerated weather radar advances. This data will become absolutely essential to storm chasers—not to mention everyone else.

Beyond these ongoing and planned projects, there are many others on the to-do list, while still others are in the discussion phase. As always, RAOB development responds to customer requests. The more requests received for a particular feature, the faster it becomes reality. New data decoders have the highest priority, since without the ability to ingest and process the data, all else is irrelevant. So, if anyone has a new data or a new need, just contact RAOB.com and let’s talk about it.

Q: Do you chase storms yourself, or was there ever a time in your life when you did?

J: I did get out a few times, but without much success. While stationed at March Air Force Base in southern California, I saw several large dust devils, but they were in hot, dry weather. However, while stationed at my first Air Force job at Offutt AFB in Nebraska, I saw something unusual. At that time I was living in a trailer on a hill—perfect for severe weather monitoring. I saw a pre-tornadic collar or wall cloud. It was large, slowly rotating, and composed of very dark green and blackish clouds.

What an incredible sight! And it was headed toward Omaha. I would have hopped in the car and gone for the chase, but I had to get ready for my weather forecast shift at Offutt AFB. I later found out that an F4 tornado developed and ripped through west-central sections of Omaha on May 6, 1975.

Q: What is your favorite kind of weather? What are some aspects of weather that particularly fascinate you or that you simply enjoy?

J: That’s easy—the awesome stuff. Anything that requires a warning gets my attention. While tornado forecasting is challenging, I found typhoon forecasting particularly exciting. I spent three years on Guam as a typhoon duty officer and loved every minute of it—but that’s another story. Typhoons and hurricanes are the king of the hill when it comes to weather phenomena. They even spawn tornados. Regarding a more subtle, weather-related event, I’m still trying to get my first glimpse of the elusive “green flash.”

———————–

There you have it: RAOB as discussed by its inventor. If this post has a somewhat commercial tone to it, take it in stride. RAOB is John’s business, and obviously he’d like to sell his product. But it’s an absolutely amazing product because it began, and continues, first and foremost as one man’s passion. Having used it for a couple years, I wanted to find out more about its development and its developer and offer my storm chasing and weather readers an article that would be both interesting and useful. The initiative has been my own, and I’ve made no money out of the effort.

While links aplenty have been furnished above, I’ll conclude with one last, handy link to the RAOB homepage in case you’d like to find out more.

Book Review: Weather Analysis and Forecasting Handbook by Tim Vasquez

I initially became acquainted with Tim Vasquez’s books a good ten or so years ago at my very first severe weather conference at the College of DuPage. Tim was sitting at a table selling, among other things, his Weather Forecasting Handbook. I bought a copy and began chewing on it, and I have continued to do so ever since over the years. There’s a lot of essential information packed into the 204 pages of the old “Purple Book.” (Tim’s books are known colloquially by the color of their covers.)

That book took me deeper into a world of meteorological concepts that I was only beginning to become aware of, ones that storm chasers need to know. My brain not being the kind that readily absorbs such stuff by reading alone, it took me a long time and many read-throughs to grasp some of the arcane principles, language, and tools that are integral to making one’s own forecasts and selecting target areas. I still have a few things to learn–okay, plenty of things–but much of the material Tim covered is now familiar to me, and I apply it regularly.

Ragged and torn from long use, my old copy of Tim’s book sits beside me now as I write. Next to it is a brand-new copy of its heir-apparent, the Weather Analysis and Forecasting Handbook.

While anyone familiar with the old book will recognize much of the material, the new Purple Book is far more than just a makeover. At 260 pages, it provides considerably more information, all of it reflecting current research and technology. This is weather forecasting as it is today, not as it was a decade ago. Indeed, so much new material has been introduced; so much of the pre-existing text has been revised and expanded; the illustrations have been updated and extended to such a degree; and the content has been so thoroughly reorganized overall, with an eye on taking the reader beyond concepts to analysis and forecasting, that the Weather Analysis and Forecasting Handbook is for all intents and purposes a new book, not just an updated edition. And, I might add–and I say this rather grudgingly, having cut my teeth on the old handbook–this new volume is a more comprehensive and helpful resource than its venerable predecessor. There is just a lot more to this book, and it’s all presented in a well-thought-out fashion.

Main Content

One significant change in the Weather Analysis and Forecasting Handbook is the organization of its content. As does the previous book, this one begins by introducing foundational physical concepts such as mass, force, pressure, temperature, the Coriolis force, geostrophic wind, vorticity, and so forth.

The second chapter on observation also appears largely familiar, though it keeps abreast of current practices. However, the previous treatment of clouds is only lightly addressed because the subject is given an entire section of its own in the book’s appendices.

Beginning with chapter three, the changes become pronounced. Here is a very abbreviated overview of the book’s structure from this point:

Chapter three: Thermodynamics–Deals with instability and familiarizes the reader with atmospheric soundings. Here is where you’ll learn how to read and interpret that essential forecasting tool, the skew-T/log-P diagram.

Chapter four: Upper Air Analysis–Taking a top-down approach to forecasting, this chapter introduces constant pressure charts, long waves and short waves, divergence and convergence, jets and jet streaks, and other atmospheric processes and influences from 100 mb down to 925 mb.

Notably missing is a structured introduction to charts for specific pressure levels, such as the 500 mb height map. That discussion has been shifted to the appendices. Instead, chapter three focuses on the various factors that the maps depict, and the book makes such liberal use of the different maps by way of illustration that the reader gains familiarity with them through osmosis. My guess is, Tim believes that by helping readers understand upper-air dynamics and processes, the significance and use of the various maps will become apparent through real-world examples.

Chapter five: Surface Analysis–Learn how to read a surface chart, get a basic grasp of air masses, and discover the importance of various boundaries, from cold and warm fronts to drylines and outflow boundaries.

Chapter six: Weather Systems–This chapter groups together concepts from several chapters in the old forecasting handbook. The presentation is logical and fresh. Subjects covered include all-important baroclinic lows and highs, barotropic systems, arctic air outbreaks, and winter weather systems.

Chapters seven and eight deal, respectively, with satellite and radar. Suffice it to say that they are required reading. Since both remote-sensing tools are visual in nature, plenty of pictures are provided to illustrate patterns, systems, outflow boundaries, velocity aliasing, severe weather signatures, and so on.

I’m a bit surprised to see not a single screen grab of a velocity couplet, either in the radar chapter or in the ensuing chapter nine on convective weather. However, velocity products rely highly on a full-color format and don’t lend themselves easily to this book’s black-and-white images. Tim points this out later in figure 9-6, where he writes, “Typical NEXRAD color schemes do not reproduce well in monochrome books.”

Importantly, the chapter on radar discusses the new dual-polarization technology that is being implemented nationwide at the time of this review. Dual-pole is a huge development in the NEXRAD system, probably the biggest stride forward since the deployment of NEXRAD itself.

Chapter nine: Convective Weather–For aspiring storm chasers, this chapter will likely be the Holy Grail of the book. Besides dealing with the ins and outs of thunderstorms, from single-cells to supercells to mesoscale convective systems, this chapter discusses storm-relative winds and introduces another indispensable forecasting tool, the hodograph. Chapter nine moves on to talk about tropical systems including hurricanes.

Chapter ten: Prognosis–This last chapter in the main body of the book deals with the actual process of forecasting. Readers will at this point have recognized that Tim is a strong advocate for understanding not merely how the atmosphere is likely to behave, and where, and when, but also why. Here he discusses the four-part forecasting process. He emphasizes the importance of a hands-on approach to analysis while at the same time recognizing the key role of numerical models, the application, strengths, and weaknesses of which he discusses at length. The chapter concludes with a brief overview of ENSO and teleconnection patterns.

The entire book is amply illustrated. Barely a page exists that doesn’t include some kind of black-and-white chart, map, or photograph. These visual supplements are clear and immensely helpful, to the extent of being integral to understanding much of the written content.

To round things out, the book is peppered with sidebar commentary ranging from the informative, to the philosophical, to the historical, to the humorous. For instance, on page 31 I find a table of NATO color codes; page 57 furnishes a thumbnail discussion of long waves; a lengthy entry on page 120 describes five different empirical forecast techniques; and on page 166, there’s a wry commentary on how to tell whether a tornado is forming using the “thumb tab” approach of the Field Guide to North American Weather.

Appendices

This section is an informational gold mine. Strangely, it’s not even mentioned in the table of contents, so I’m going to give you the breakdown here:

Appendix one: Forecaster’s Guide to Cloud Types–Photos and descriptions of major cloud types, including brief discussions of each one’s significance from a forecasting standpoint.

Appendix two: Surface Station Plots–What all those numbers and symbols mean.

Appendix three: Surface Chart Analysis Procedures–Brief guidelines for doing surface analyses.

Appendix four: Upper Air Station Plots–Similar to the second appendix, except applied to upper air plots.

Appendix five: Upper Air Chart Analysis Procedures–This is about as close to an overview of specific pressure maps as this book provides, which it does from an analysis perspective. This appendix divides into three short sections on upper-, middle-, and lower-tropospheric charts. Between them, they provide insights on the significance, use, and analysis of upper-air maps from 100 millibars all the way down to 925 millibars.

Appendix six: An Isoplething Tutorial–Veteran forecasters invariably are strong advocates of hand analysis, and Tim is a prime example This appendix shows you how to get started at creating your own hand-analyzed weather maps.

Appendix seven: Conversions and Symbols.

Appendix eight: Instability Index Summaries–Brief discussions of the more commonly used forecasting indices such as CAPE, CINH, lifted indices, the energy-helicity index, and the SWEAT index. A couple of these tools–BRN shear and storm-relative helicity–aren’t in themselves related to instability; however they’re so widely used in severe weather forecasting that they require discussion, particularly since they’re factored into such true instability indices as the EHI, STP, and Bulk Richardson Number.

Appendix nine: Types of Thermodynamic Diagrams–Brief discussions and graphic examples of the skew-T/log-P, emagram, Stuve, pastagram, aerogram, and tephigram.

Appendix ten: Blank Diagrams–Reproducible blank skew-T and hodograph.

Appendix eleven: Observation Format Overview–For the incredibly geekish, a quick reference guide to the most commonly used weather-reporting formats: METAR, SYNOP, and TEMP (radiosonde code).

Additional appendix materials without assigned section numbers include the following: suggested reading, software, educational websites, government weather agency websites, and top-ten weather myths.

Three Recommendations


Let me preface my following few critiques by saying that this is a fantastic book. The author is both a veteran storm chaser and an educator, and that combination has inspired him to create a practical resource that is both accessible to lay-persons and helpful to operational forecasters. Storm chasers and anyone who wants to develop skill at weather forecasting would do well to put it in their library.

This said, I have three comments that Tim may wish to consider at some point:

• I liked the old handbook’s quick, specific introductions to the 200/250/300 mb, 500 mb, 700 mb, 850 mb, and surface charts. The overviews of those charts gave me–at a time when I was a complete novice and needed weather knowledge delivered to me in brick form–an instant, systematized reference to the constant-pressure maps that are such essential tools of the trade.

Granted, entire books have been written about weather maps, including Tim’s own Green Book, the Weather Map Handbook. The new Weather Analysis and Forecasting Handbook is obviously not intended to fill such a role. But perhaps in the appendix section, the fifth appendix could be fleshed out a bit by providing a top-down sampling of CONUS maps for a single date/time. That way those unfamiliar with upper atmospheric maps could see how, say, March 13, 2011, at 1200 UTC mapped out at 300 mbs, 500 mbs, 700 mbs, 850 mbs, 925 mbs, and on the surface.

• Granted the limitations of trying to translate something as color-dependent as radar velocity products into a gray-scale format, there may nevertheless be a benefit to making the attempt. I say this because the ability to recognize storm-relative velocity couplets is so critical in storm chasing. While the illustrations on page 145 (figs. 8-2a–f) do a good job of conveying the general idea, there’s nothing like real-life examples. Perhaps such examples could be included in the future, whether directly in the book or possibly as a link to a page featuring radar screen captures on Tim’s Weather Graphics website.

• A quick, easy-reference glossary of essential terms would be a welcome addition.

With these three suggestions on the table for Tim to consider in his next edition, I unhesitatingly recommend this book. It’s superb, a labor of love by one of the gurus of operational forecasting who clearly cares a great deal about helping others learn the ropes.

Some months back, I reviewed Tim’s other recent publication, Severe Storm Forecasting. It’s another excellent resource for storm chasers in particular, covering some of the same ground as this book and expanding considerably on the subject covered in chapter nine, “Convective Weather.” Good as that book is, though, Weather Analysis and Forecasting provides the more complete, well-rounded picture. Be forewarned: it’s not a book you will read and absorb in one sitting. It is chewy material that will require you to approach it analytically and patiently. This is a resource you will pull off the shelf again and again, whether to re-engage with material you’re still trying to grasp or to refresh yourself on concepts you’re already familiar with.

Purchasing Information

  • Weather Forecasting and Analysis by Tim Vasquez, 260 pages.
  • $29.95 plus shipping, available from Weather Graphics.

NOTE: This is a non-paid review. I’ve written it as a service to my readers and to Tim because, having read the book, I’m convinced of its value for storm chasers and severe weather buffs.

The Noob: A Review of Adam Lucio’s New Storm Chasing DVD

June 17, 2010. If you were in Minnesota on that date, I need say no more. Regretfully, I was not there. But Adam Lucio was, and in his new DVD chronicling his chases from 2008 till today, Adam’s Minnesota chase–which rewarded him with some of the most visually stunning tornadoes of circum 2010–is just one in a list of potent tornado events captured on video.

No, it’s not the next best thing to being there in Minnesota–how could it be? What it is, is great footage of some spectacular storms, the kind of video that makes me wish like anything that I had been there and glad that Adam has done such a good job of showing me what I missed.

If for no other reason than the 2010 Minnesota outbreak, Adam’s DVD is a viewing windfall for storm chasers and weather junkies. However, June 17 is just one of a number of memorable chases that appear in The Noob. More recent footage from 2011 includes the dusty EF-3 Litchfield, Illinois, cone of April 19; a turbulent EF-4 wedge from the historic April 27 Super Outbreak; and the violent Oklahoma storms of May 24.

The Noob also whisks me down Memory Lane to May 22, 2010, in South Dakota, an unforgettable day for those of us who chased the northern plains. And heading back even further, Adam shares some visceral footage from 2008 of a large tornado crossing I-57 south of Chicago, his hometown.

At nearly two hours in length, Adam’s DVD covers a lot of material, and I’m not going to attempt a blow-by-blow analysis of it all. I’m just going to comment on a few highlights and let you discover the rest for yourself when you buy the DVD. Which you should do. You’ll congratulate yourself on your purchase every time you watch it.

I’ve already mentioned the Minnesota outbreak of June 17, 2010. This is the one section of the DVD where I took notes, because the storm was simply incredible. The video first shows an initial elephant trunk near Kiester. It’s followed by another much larger tornado, and from here the drama rapidly ramps up. I’ve heard some guys describe this date as their best chase ever, and I can see why: there’s a lot going on with both the tornadoes and the surrounding sky.

As the second, dark wedge does a multi-vortex dance on the other side of a distant woodlot, a new circulation rapidly develops in the foreground. There appears to be no handoff of energy from one circulation to the other at this point; for a while, presumably, two distinct, large tornadoes coexist in close proximity to each other. Eventually, however, we’re left with just one large, white cone surrounded by a huge, rapidly revolving collar cloud. The effect, already spectacular, becomes even moreso as the tornado moves toward Conger and then onward toward Albert Lea. It is a monstrous, long-track tornado that displays every shape and behavior in the book.

What at times captivated me as much as the tornado was the behavior of the clouds in the foreground. There’s at least one instance where you can see clear signs of anti-cyclonic rotation, both on a broader scale and in smaller swirls of cloud. It’s amazing to watch. And so is the horizontal vortex that passes overhead. The 1 km helicity near this storm had to have been just plain crazy.

Moving on, the Alabama footage is engaging not so much from a visual as a historical standpoint. Don’t misunderstand me, it’s good, entertaining viewing; it’s just nothing like the Minnesota section. What makes it remarkable is the date: April 27, the day of the 2011 Super Outbreak. Not since the infamous 1974 Super Outbreak have so many powerful tornadoes wrought such havoc in a single day. For that reason, this section of The Noob may be of historic interest in the future.

The May 22, 2011, South Dakota footage captures another spectacular, beautifully structured storm. What sets it apart, however, is the insanity of that a number of chasers experienced when the road they chose for an escape route dead-ended in a farmer’s wheat field. Adam was among them, along with his chase partners, Ben Holcomb and Danny Neal. With multiple tornadoes spinning up and advancing toward them, the chasers took the only evasive action they had left by bailing south into the field, where ponding eventually cut them off. “Game over,” as Adam put it. From that point, all they could do was hunker down and brace themselves until … well, you’ll just have to see for yourself what happened. Ben Holcomb captured the intensity of that part of the chase on camera, and Adam has included Ben’s video as part of the South Dakota section.

I might add, my buddies and I were in that same field just a stone’s throw from Adam’s vehicle, and I remember well how it was that day. But some of the footage here reveals things even I didn’t see, and viewing it makes me realize how truly blessed all of us were to have escaped without injury.

I could continue on, but you get the idea. The Noob is a great storm chasing DVD that delivers a huge amount of bang for your 14-and-99/100 bucks.

Adam is a passionate and capable chaser who takes every opportunity available to him to go where the storms will be. The title of his new DVD reflects to me both humor and humility, winsome qualities in any person.

The Noob is raw chasing. Adam clearly invested time and care in editing his material, and he offers a few nice editorial touches (such as Ben Holcomb’s embedded footage during part of the hair-raising South Dakota field escapade). For the most part, however, the DVD doesn’t get too fancy. In my book, that’s a plus. The occasional splashes of background music are conservatively used, not overdone, and hence a welcome addition rather than a subtraction from the focus of this video, which is tornadoes and the experience of chasing them.
.

Critique

Is there room for improvement? Sure. Much of the video footage is hand-held, which makes for slightly to drastically shaky viewing. Of course, this is real-life chasing–not a professional film crew, just one guy with a camera coping with constantly changing conditions as he pursues the most violent and volatile weather phenomenon on the planet. Some of the storms were clearly moving fast, and Adam didn’t have time to park his vehicle, set up his tripod, toss out a lawn chair, and sip his favorite beverage, iced tea, while casually filming. I noticed that he made better use of his tripod with slower moving storms. In any event, I’m pretty sure he has already been considering how he might get more stable shots next season.

My second comment: There were times when I wanted to see a continuing view of a tornado’s interaction with the ground, not the sky. In the Minnesota footage, a large wedge barely misses two farms, appearing to barely graze behind them. Yet the camera drifts away from the drama on the ground–it had to have been terrifyingly dramatic for the people living at those farms–to the cloud base, back and forth. There’s enough ground footage to give a good feel for what’s happening; still, I want the focus to remain on the lower part of the funnel as it sweeps past past human habitations, so I can dwell on the story unfolding there at the surface.

With those two critiques out of the way, the only question left is, do I recommend this DVD?

Are you kidding? Absolutely! Yes. Buy it. Watch it once, watch it again, watch it multiple times. This is killer stuff.
.

Purchasing Information

The Noob is 1 hour, 57 minutes long. Purchase price is $14.99 ($17.99 international). For more information and to place your order, visit Adam’s site.

Book Review: Severe Storm Forecasting by Tim Vasquez

Beginning with his Weather Forecasting Handbook, which I purchased years ago at a College of DuPage severe weather conference, I’ve collected one-by-one nearly all of Tim Vasquez’s books on storm chasing and weather. The only exception is Tim’s most recent, 2011 publication, the Weather Forecasting and Analysis Handbook, and that’s next on my list.

The owner of Weather Graphics and the well-known storm chasing forum, Stormtrack, Tim is a widely acknowledged guru of storm chasing and operational forecasting, particularly in the severe weather arena. The man possesses more convective knowledge in his left pinkie than most of us do in our entire bodies, and in this fairly recent publication, he organizes information that is most relevant to chasers and severe weather junkies.

In Tim’s words, “Severe Storm Forecasting was a project started in 2007 to serve as the perfect companion for intermediate forecasters and a refresher for experienced forecasters. It maps the current state of severe thunderstorm forecasting from an operational framework rather than a research or academic perspective. Equations, physics, and lengthy citations have been kept to a bare minimum.” (From the preface.)

In other words, the book is intended to provide up-to-date, practical information that storm chasers can readily apply in forecasting and in the field. Since its release in 2010, I’ve been wanting to get my hands on this book. A while ago, I finally shelled out my $29.95 and purchased a copy, and I’ve spent the last several weeks chewing on it. It’s nutritious fare: thoughtfully organized, as current as is possible in a field shaped by rapid technological advances, and accessible to anyone who wants to apply him- or herself to developing severe weather forecasting skills.

Severe Storm Forecasting is divided into 10 sections as follows:

  • The Forecast Process
  • The Thunderstorm
  • Mesoscale Convective Systems
  • Tornadoes
  • Hail
  • Lightning
  • Stability & Shear
  • Radar
  • Satellite
  • Diagnosis
  • .
    An appendix contains additional information on the WSR-88D radar and the more commonly used diagnostic tools in severe weather forecasting, and also supplies blank, reproducible hodograph and skew-T/log-P charts.

    While the topics covered will be familiar to chasers who do their own forecasting, I’ve found plenty to broaden my scope, ranging from brand-new insights to discussions on topics with which I was only vaguely acquainted. For example, the section on QLCS tornadoes is the first time I’ve seen the subject given more than a casual nod. Here in Michigan, linear systems are far more common than isolated supercells, so it’s nice to encounter a book that spends a little time looking at their role as occasional tornado breeders.

    A strong asset of Severe Storm Forecasting is the way it aggregates the broad array of elements that are relevant to severe weather and then expands on them in one tidy package. Don’t get me wrong: this isn’t one-stop shopping. One book simply can’t cover everything in depth; pick any chapter and you can make a further study of its subject. But this book does much more than skim the surface. It is by no means a mere primer; it is a text that will equip you with a broad and substantial grasp of severe weather forecasting, and you shouldn’t conceive of it as a one-time read that you move through linearly and then “finish.” There’s too much content for a reader to absorb all in one pass, and much of it needs to be connected with field experience in order for it to gel. So look at Severe Storm Forecasting as a reference that you will process bit by bit. Once you’ve accomplished your initial read, you will return to it again and again.

    In the style of his other books, Tim has made ample use of sidebars to provide interesting asides that range from the historical to the technical. Just riffling through the pages, I find, for example, a call-out on page 75 that consists of material written in 1888 by Gustavus Hinrichs that sheds light on the origin of the word “derecho”; then a few pages later, on page 80, I read a smaller sidebar that discusses the term “swirl ratio”; and still further along, on page 95, I come across a fairly extensive personal communication from Paul Markowski on the contributing factors in warm versus cold RFDs.

    Three recommendations for improvement:

    1. 1. I’m surprised that a glossary was not included in a work of this nature. It is the one area in which I consider this book to be lacking, and I hope Tim will address the matter in his next edition.
    2. 2. An online supplement would add value. This could feature graphic, possibly interactive, examples of such topics as lifting and modifying forecast soundings, radar interpretation, and so forth. The supplement would be accessible only to purchasers using a code included in the back of the book. It could be used with other of Tim’s books as well, so one supplement could serve multiple purposes.
    3. 3. I have the sense that the editing was grassroots. The result is quite good, but speaking as someone with a background in publishing, I think the book could benefit from further proofreading or perhaps a light edit.

    With these things said, Severe Storm Forecasting is an eminently useful and well-done resource that belongs in a storm chaser’s library. If you’re a new chaser, I would recommend that you start with Storm Chasing Handbook, also by Tim; then purchase this book to expand your knowledge. Those with a bit more experience can jump right in. Regardless of your level of expertise, get this book. At some point, you’re either going to be glad you own it or else wish that you did.

    Purchasing Information

    • Severe Storm Forecasting by Tim Vasquez, 262 pages.
    • $29.95 plus shipping, available from Weather Graphics.

    NOTE: This is a non-paid, unsolicited review. I’ve written it as a service to my readers because I personally appreciate Tim’s book and feel that it provides a valuable and well-organized resource for storm chasers and severe weather buffs.

    Relocated: A Review of Ben Holcomb’s 2011 Storm Chasing DVD

    With his newly released second storm chasing DVD, Relocated, Ben Holcomb has done a fabulous job of capturing the action out west during 2011, a banner year for chasers. I just finished watching the DVD with Kurt Hulst. That makes my third time, and I’ve only had the video for a week.

    I much enjoyed Ben’s maiden voyage DVD, which shows highlights from his first three years of chasing. Relocated improves on that foundation. As its name implies, this DVD reflects Ben’s move from Lansing, Michigan, to Norman, Oklahoma, smack in the heart of Tornado Alley. It also demonstrates Ben’s development as a videographer and producer, as evidenced by the quality of both the content and the packaging. From laid back to intense to pure wow, the moods and dialog in Relocated cover a variety of situations a chaser is apt to experience; and the storms are always the star of the show, which is how it should be.

    While I’m on that last subject, one thing I appreciate about this video is its conservative use of background music. I enjoy a certain amount of music for spice, but not a lot. Mostly, I like to hear the environmental sounds of the chase–the crack of thunder, swoosh of the wind, and clatter of hail; the spontaneous comments and interactions of chasers; even the road noise and the sound of the car engine. I want to feel like I’m there, and this video does that for me.

    Anyone who knows Ben knows how passionate he is about chasing. He moved to Oklahoma to maximize his opportunities to chase tornadoes, and 2011 rewarded him with a bumper crop. The action starts on April 9 in Mapleton, Iowa, a day that drew a lot of chasers out for an early chase. This section ends with a neat synchronization of freeze frames with music. I won’t say more–you’ll have to see for yourself. I’ll just tell you that it’s clever and nicely executed.

    A couple weeks later, on April 24, things appear to have gotten a bit hairy for the Benster out in Baird, Texas. As he trains his camera on a distant lowering, a vortex spins up in the field next to him, and it becomes clear that circulation is establishing itself directly overhead. Call me a wuss, but that is the kind of situation that would make me pee like an elderly aunt in a beer tent, and it evidently inspired Ben to lean plenty on the accelerator, all the while continuing to shoot video. The result is some exciting footage shot at uncomfortably close range, and for me it’s the adrenaline spike of this DVD. Don’t try anything similar at home.

    The footage from the May 24 Oklahoma outbreak is outstanding. What more could a chaser possibly want? The Chickasha EF4 grows rapidly from a cone to a powerful stovepipe as it crosses the road and then moves past Ben’s position at a distance of perhaps three-quarters of a mile (just guessing here). The tornado continues to grow into a violent wedge with a collar cloud circulating around it like a monstrous merry-go-round, dropping lower and lower toward an immense dust plume that rises up to meet it. Remember I mentioned that this video packs wow-ness? Well, here is a prime example.

    Next, Ben captures a spectacularly beautiful white rope-out of the Shawnee tornado, which crosses the highway, then more-or-less anchors in a field and attenuates into nothingness as debris drifts out of the sky, sparkling in the sunlight. The camera probes high up the side of the disintegrating rope funnel, all the way up to its juncture with the cloud base. Very nice.

    The June 20 section, shot in Nebraska with J. R. Hehnly, is one I find a bit frustrating to watch because I missed the tornadoes myself by about an hour. Not Ben. He got great, ongoing footage of a cyclic supercell that kept popping out tubes one after the other. A high point, fairly early in this part of the DVD, is some fantastic multiple vortex action after the first tornado crosses the road in front of the vehicle and then intensifies. You see a gorgeous white cone with suction vortices pirouetting around its base, an elegant egg-beater. It’s my favorite scene in a DVD that’s full of great tornado videography, and I’m caught between admiring the storm’s beauty and wanting to bang my head against a wall. Aaagh! Sixty more miles…one lousy hour sooner…nutz. Bad for me, but good for Ben and J. R.

    That’s it for the tornadoes, but Ben has sweetened the deal with bonus footage of the last launch of the Atlantis space shuttle. Right, that has nothing to do with storm chasing, but it was obviously a standout event for Ben, as it would have been for anyone. So why not conclude this 75-minute DVD with a personal glimpse of a historic moment?

    Relocated is a thoroughly satisfying video that anyone with a jones for tornadoes and severe weather will enjoy. Be aware, though, that this is the real deal, a realistic and personal presentation of storm chasing as most chasers experience it rather than what reality TV has made it out to be. The camera is often hand-held by a guy who is either simultaneously driving or else trying to gain an optimal view from the passenger seat. That’s part of the package, and it makes for an honest and engaging production.

    Purchasing Information
    Purchase price for Relocated is $15.00 plus $2.00 shipping. For more information and to place your order, visit Ben’s site, where you can also buy his first video, My First Three Years, for the same price. Or save $2.00 when you purchase both videos together for just $28.00 plus shipping.

    If you’re looking for some great storm footage to while away the hours from now until spring, buy this video. And no, Ben didn’t pay me to say that or to write this review. I took it upon myself to do so because Ben is a good friend, a passionate chaser, and a guy who puts not only expertise but also a considerable amount of heart into what he does. Which is why Relocated rocks, and why it belongs in your video collection.