Intercepting the March 2, 2012, Palmyra-Henryville-Marysville, Indiana, Tornado

Now, while my video from Friday’s chase is uploading to YouTube, is a good time for me to write my account of how things transpired down in southern Indiana.

The phrase “historic event” rarely describes something good when applied to severe weather. March 2 may qualify as a historic event. The current NOAA tally of tornado reports stands at 117; the final number, while likely smaller once storm surveys have been completed and multiple reports of identical storms have been consolidated, may still set Friday’s outbreak apart as the most prolific ever for the month of March. Whether or not that proves true, Friday was unquestionably a horrible tornado day that affected a lot of communities from southern Indiana and Ohio southward.

The Storm Prediction Center did an excellent job of keeping track of the developing system, highlighting a broad swath of the eastern CONUS for a light risk in the Day Three Convective Outlooks and upgrading the area on Day Two to a moderate risk. On Day One, the first high risk of 2012 was issued for a four-state region that took in southern Indiana and southwest Ohio, most of Kentucky, and north-central Tennessee–a bullseye in the middle of a larger moderate risk that cut slightly farther north and east and swept across much of Mississippi and Alabama as well as northwestern Georgia.

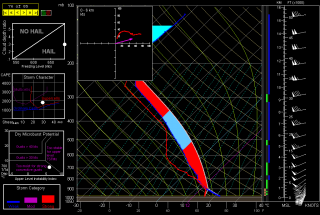
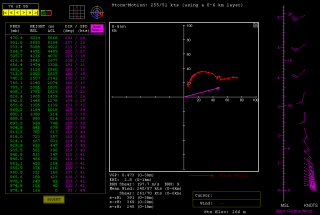
The SPC and NWS offices weren’t the only ones keeping vigilance. Storm chasers across the country were watching the unfolding scenario, among them being my good friend Bill Oosterbaan and me. Here are the February 29 00Z NAM model sounding and hodograph for March 2, forecast hour 21Z, at Louisville, Kentucky. (Click on the images to enlarge them.) With MLCAPE over 1,800 J/kg, 0-6 km bulk shear of 70 knots, and 1 km storm-relative helicity at 245 m2/s2, the right stuff seemed to be coming together. By the time the storms actually started firing, those figures were probably conservative, particularly the low-level helicity, which I recall being more in the order of 400 m2/s2 and up. Simply put, the region was going to offer a volatile combination of moderate instability overlaid by a >50-knot low-level jet, with a 100-plus-knot mid-level jet core ripping in.

I had my eyes set on southeastern Indiana. The problem with that area is, it’s lousy chase terrain along the Ohio River, and it doesn’t improve southward. If there was an ace-in-the-hole, it was Bill’s knowledge of the territory, gleaned from his many business trips to Louisville.

We hit the road at 7:15 that morning, stopping for half an hour in Elkhart so Bill could meet with a client and then continuing southward toward Louisville. Bill was of a mind to head into Kentucky, where the EHIs and CAPE were higher; I was inclined to stay farther north, closer to the jet max, the warm front, and, presumably, stronger helicity. But either choice seemed likely to furnish storms, and since Bill was driving, has good instincts, and knows and likes western Kentucky, I was okay with targeting the heart of the high risk rather than its northern edge.

But that plan changed as we drew near to Louisville. By then, storms were already firing, and one cell to our southwest began to take on a classic supercellular appearance. Bill was still for heading into Kentucky at that point, but after awhile, a second cell matured out ahead of the first one. We now had two beautiful, classic supercells to our southwest, both displaying strong rotation. It was a case of the old adage, “A bird in the hand is worth two in the bush”–except in this case, there were two birds, back to back. And I-64 would give us a clear shot at both of them.

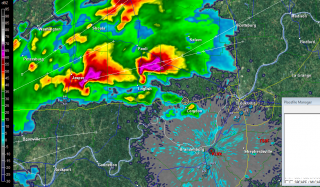
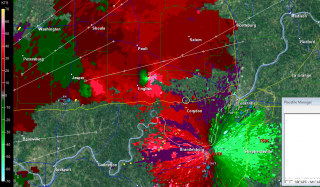
So west we went, and into chase mode. At the Corydon exit, we caught SR 135 north, headed for an intercept with the first supercell. The two radar captures show the base reflectivity and SRV shortly after we began heading up the state road.

A few miles south of Palmyra, we got our first glimpse of a wall cloud maybe four miles distant. That’s all there was at that point, and the hilly, forested terrain afforded less-than-optimal viewing. Within a minute or two, we emerged into an open area just in time to see a funnel descend from the cloud. Tornado!

The sirens were sounding in Palmyra, providing an eldritch auditory backdrop to the ropy funnel writhing in the distance as we drove through town. The tornado went through various permutations before expanding into a condensation cone revolving like a great auger above the treeline. It was travelling fast–a good 60 miles an hour, at a guess. As we sped toward it, the condensation hosed its way fully to the ground and the tornado began to broaden. It crossed the road about a half-mile ahead of us, continuing to intensify into what appeared to be a violent-class tornado with auxiliary vortices wrapping around it helically.

Shortly after, Bill and I came upon the damage path. We pulled into a side road lined with snapped trees, amid which a house stood, somehow untouched except for a number of peeled shingles. The tornado loomed over the forest beyond, an immense, smoky white column wrapping around itself, rampaging northeastward toward its fateful encounters with Henryville and Marysville.

The time was just a few minutes before 3:00 eastern time. While I prepared and sent a report to Spotter Network, Bill turned around and headed back south. We had another storm to think about, and it was closing in rapidly. It wouldn’t do to get caught in its way.

Back in Palmyra, we headed west and soon came in sight of another wall cloud. This storm also reportedly went tornadic, but it never produced during the short time that we tracked with it. We lost it north of Palmyra; given the topography, the roads, and the storm speed, there was no question of chasing it.

From that point, we headed south across the river into Kentucky to try our hand at other storms, but we saw no more tornadoes, nor, for that matter, much in the way of any serious weather. Not that there weren’t plenty more tornado-warned storms; we just couldn’t intercept them, and after giving it our best shot, we turned around and headed for home.

Lest I forget: my worst moment of the chase came when I couldn’t locate my video of the tornado in my camera’s playback files. It seemed unfathomable that I could have horribly botched my chance to finally capture decent tornado footage with my first-ever hi-def camera. After being miserably sidelined during last year’s record-breaking tornado season, the thought that I had somehow failed to record this day’s incredible intercept just sickened me. Fortunately, there were no sharp objects readily available; and better yet, the following morning I discovered that I had simply failed to scroll up properly in the playback mode. All my video was there, and it was spectacular. Here it is:

My excitement over the video was offset by reports of just how much devastation this tornado caused eighteen miles northeast of where it crossed the road in front of Bill and me. Henryville, obliterated. Marysville, gone. Eleven lives lost in the course of that monster’s fifty-two-mile jaunt. And similar scenarios duplicated in other communities across the South and East. The death toll for the March 2 outbreak presently stands at around forty.

In the face of a mild winter and an early spring, Friday was the inauguration for what may be yet another very active severe weather season east of the Mississippi. We can only hope that there will be no repeats of last year’s wholesale horrors. May God be with those have lost loved ones and property in Friday’s tornadoes.
Tornado Weather Enters with 2012 Meteorological Spring

Today is the first day of meteorological spring, and while March is poised to come in like a lion, there may be nothing lamb-like about its exit. Not if these past few days and tomorrow’s setup are any indication of what to expect.

Tuesday saw 25 tornadoes in Nebraska, Kansas, Missouri, and Illinois, with several fatalities. Wednesday logged another ten in Indiana and Kentucky. Today is another light-risk day, and tomorrow the SPC has outlooked a large swath from southern Indiana and Ohio down through Kentucky and Tennessee to northern Mississippi and Alabama in a moderate risk.

Like most storm chasers, I’ve been watching this system for several days. Typical of early-season setups, it will be a dynamic system driven by crazy upper-level winds and a strong low-level jet overspreading weak to moderate instability. With this kind of setup, 500 J/kg CAPE can get the job done. But with storm motions this fast, intercepting them will be more like a skeet shoot than a chase.

Regardless, I expect to head out tomorrow for my first chase of the year. I’ve been casting my eyes on southeastern Indiana and southwestern Ohio, not far south of where the peak 500 mb jet energy will be nosing in. I notice that the latest NAM is a bit more conservative with instability, nudging it southward, so I guess the question is, how far south does one want to travel for this kind of fast-moving system? Probably not very. I don’t see the point of going after fast-moving storms in Kentucky or Tennessee in hilly, woodsy terrain that obscures the view. That’s a discussion point with Kurt and Bill, since the three of us will likely chase together.

This looks to be a dangerous situation across northern Dixie Alley. Crossing fingers and hoping for minimal impact on communities tomorrow afternoon into the night.

An Interview with RAOB Developer John Shewchuk

Two of the handier implements in a storm chaser’s forecasting toolkit are the skew-T/log-P and the hodograph. These two charts typically come bundled together, furnishing vertical slices of the upper air that show graphically how the atmosphere is behaving—or, in the case of forecast soundings, is projected to behave—from 100 millibars all the way down to the surface.

If you want to see at a glance how unstable the atmosphere is and how much convective inhibition suppresses that instability, look at a skew-T. If you want to know in what direction and how fast storms are likely to move and how much low-level helicity they’re likely to ingest, consult a hodograph. The skew-T and hodograph, along with a multitude of derived indices that often attend them, provide a wealth of vital information.

Soundings can be obtained from a variety of sources, many of them free. Among those sources, RAOB is in a league of its own. Its website homepage describes it as “the world’s most powerful and innovative sounding software. Automatically decodes data from 45 different formats and plots data on 12 interactive displays including skew-Ts, hodographs, & cross-sections. Produces displays of over 200 atmospheric parameters including icing, turbulence, wind shear, clouds, inversions and more.”

A couple years ago, I purchased the Basic module and several others—the Analytic, the Hodograph and Interactive, the Advanced Cross-Section, and the Special Data Decoders—and thus gained empirical familiarity with the powers of RAOB. It is an amazing program, all the moreso for its ease of use. Yet I have to confess that I’ve only scratched its surface. I simply don’t have the know-how to tap into its full capabilities. The more meteorologically and technically astute a user is, and the deeper one wants to dig into the atmosphere, the more RAOB will deliver.

In this interview, RAOB developer John Shewchuk talks about his brainchild. John presents his bio thus:

My life in three steps: (1) Born at West Point, New York—so I knew I wanted to be a military guy. (2) Started playing the accordion at age eight—because my parents told me to. (3) Got interested in weather during high school—because it fascinated me. Putting the three all together, I went to Penn State for my meteorology degree while playing the “Rain, Rain Polka” at parties for extra income, and I graduated with an ROTC commission in the Air Force. After twenty-two years in the USAF Weather Service, I retired as a lieutenant colonel.

I am now back in my hometown of Matamoras, Pennsylvania, in the house that my grandpa built. Here I operate the RAOB factory with loving assistance from my wife, Elaine.  Of course, that assistance remains loving as long as I also play music other than polkas, like maybe “Stormy Weather” or “Misty” and songs from the Four Seasons group.

That’s John in his own words. I will add one other thing: he is one of the most service-oriented persons you’re ever likely to encounter. While I forget what my first support issue involved, I haven’t forgotten John’s response. He was right there, responding quickly and helpfully, and he has continued to be “right there” ever since.

Be forwarned, the following is a lengthy interview. I’ve considered breaking it into two installments, but I don’t think it lends itself well to that approach. So I’m leaving it intact, trusting that storm chasers, meteorologists, and anyone interested in cutting-edge weather technology will find this post worth reading in its entirety.

Interview with RAOB Developer John Shewchuk

.
Question: RAOB is incredibly sophisticated weather software. I understand that it is the most powerful of its kind in the world—true? What is your background that equipped you to create it?

John: True in that no other program offers the same degree of functionality and capability in a very user-friendly interface. My twenty-two years in the USAF Weather Service and eight worldwide assignments were fundamental to my knowledge of meteorology. College academics were a good start, but the hands-on, daily routine of creating weather maps and issuing operational forecasts were invaluable to understanding how weather really works.

The majority of my severe weather experience comes from eleven years of multiple assignments at Offutt Air Force Base in Omaha, Nebraska. Other valuable experiences came from duties as a science officer and while stationed at the Typhoon Warning Center in Guam.

But knowledge of meteorology is only part of the story; computer programming is the other part. While at college, I also became fascinated with the power of computer code and spend many hours dabbling with Fortran IV. That interest remained mostly dormant while in the Air Force, as I only used automation as it related to daily duties. But when the personal computer hit the public market, I bought my first PC, the Tandy 1000.

Wow, what power! What a thrill to be able to channel electrons into intelligent processes through computer code. My life had changed dramatically, and my accordion became jealous. I taught myself Visual Basic (since it was similar to Fortran) and began to write small DOS programs. I soon upgraded to a VGA color monitor, a dot-matrix printer, a second floppy disk drive, and more memory. And then, after some deliberation—about two seconds—I went all the way. I broke open my piggy bank and got my first harddrive. Six hundred dollars for a whopping 20 Mb—what a deal! I had now attained nirvana.

I started to write small computer games for my kids and utilities for myself and others. I later began publishing computer and software articles for a PC magazine and won some programming contests. And just to remain in good standing with my accordion, I joined a local community polka band and performed at some fun Octoberfests at California’s Big Bear Lake and other local events. I just love those oompah bands!  I later appeared as the guest PJ (Polka Jockey, versus the more traditional DJ or Disk Jockey) for my wife’s surprise retirement party.  I used the fake beard and mustache to hide my identity since I wasn’t part of the oompah musicians union.

Q: What first inspired you to create RAOB, and when did you begin working on it? How long did it take before the first version was ready for release?

J: While programming games for the kids and utilities for others, I never considered meteorological applications. I instead used the time as a diversion from work—more like relaxation. During this time, I was aware that there were a very few, simple skew-T programs available, but only to large platform government and corporate entities.

But then toward the end of my Air Force career, I heard that one company was creating an advanced interactive weather display and skew-T system for military use for some very big bucks. So then I said, “Hmm, I think I can do a better job for much less.” That was twenty-four years ago.

I soon stopped programming kids’games and started the slow and systematic construction of a skew-T program. Remember, this was all off-duty time, during nights and weekends, and was still in the good old DOS days. My goal was never to market the program, but only to use it as my personal analysis tool, since after military retirement, I planned to use the program to help me with my intended weather consulting business.

In the end, that consulting business never amounted to much. However, soon after beginning the skew-T project, I met Richard Cale at a local American Meteorological Society monthly meeting. Richard (now deceased) had a very successful weather consulting business and helped me obtain my license as a Certified Consulting Meteorologist.

More importantly, for the previous ten years, Richard had been developing advanced upper-air applications on his hand-held, programmable Texas Instrument calculator (a TI-59) while tediously hand-plotting skew-T diagrams.  Within twenty-four hours we met again and began a wonderful collaboration on the skew-T project. In return for access to his analysis notes and algorithms, I gave him exclusive use of the developing skew-T program, now called RAOB.

Over the next several months, RAOB developed into a functional skew-T program that could accurately process and plot sounding data using a simple user format.  At Richard’s insistence, I added graphic interactive capabilities, which made RAOB a powerful data interrogation tool. These interactive capabilities, such as click-and-drag and other graphic editing features, made RAOB ideal for atmospheric research and forensic applications—perfect for a consulting meteorologist or anyone needing fast and accurate answers to “what if” questions.

Richard was delighted, as RAOB significantly improved his capabilities and productivity. And I was happy to now have a functioning skew-T program. However, it was of no use to me in my now-struggling weather consulting business, which mainly consisted of weather-related slip-and-fall and property damage cases. So, in order to pay the bills, I had to take a full-time salaried day job as a database manager. It was not a weather job, but it at least allowed me to stay current in the field of automation.

Just when I thought my weather career was nearing its end, Richard and some other friends suggested that I try selling RAOB, especially since Internet marketing and webmail were rapidly evolving at that time. In 1997, nearly ten years after the program’s inception, I sold the first RAOB (DOS) program. RAOB had transitioned from a hobby to a business.

After five more years, I converted RAOB from a DOS program to a Windows-based application. I am now retired from my day job and work full-time on the RAOB program—finally.

Q: Who are some of your customers, and what are some of the various, perhaps unique, ways in which they use RAOB?

J: RAOB customers are worldwide and are in sixty-four countries (that I know of). I am pleased to say that RAOB is used by the NTSB, NASA, EPA, over 110 universities and many high schools, over 450 TV weather stations, many NWS offices, several US and foreign military services, and other numerous interests from industry, commerce, and public safety.

Special applications include the monitoring of high-value properties such as airports, where RAOB automatically downloads new data, updates various diagram displays, and produces alert notifications of everything from low-level wind shear to fog threats. Competitive soaring pilots also like RAOB because it can identify the altitude, wavelength, and vertical displacement of mountain waves, which are critical during long-distance racing. Other clients use RAOB for detailed analyses of freezing levels, frontal zones, and inversions in the application of cloud seeding for hail suppression purposes. Due to its unique, high-resolution, interactive capabilities, RAOB is the perfect tool for educational and research purposes, both private and government. And storm chasers are always asking for new indices and parameters, which I add at every opportunity.

Q: Storm chasers have various options for obtaining free forecast soundings, two popular ones being TwisterData and Earl Barker. BufKit obviously offers an amazing array of features. What are some advantages of RAOB that set it apart, and that chasers might particularly value?

J: RAOB has five unique advantages over the above free sources of sounding data: (1) RAOB can automatically detect and analyze over forty-five different sounding data formats. New decoders are constantly being added to RAOB while the older ones are kept up to date. For those formats not yet automatically decoded, the user can manually input sounding data into RAOB’s two different data editors. With these flexible input options, RAOB can process any sounding data.

(2) RAOB allows the experienced user to graphically adjust, or edit, any sounding data point—temperature, dewpoint, and wind—and watch the resulting parameter listings and diagrams instantly update on the screen. This can be done on the sounding skew-T diagrams and hodographs.

There is also a special DALR (dry adiabatic lapse rate) function that can automatically adjust the lower atmosphere to simulate heating of the boundary layer, which is a critical parameter in severe weather analyses. These graphic adjustment capabilities give RAOB users a powerful “what if” tool.

(3) While many sources of gridded weather maps and associated forecast soundings are available via the Internet, they lag the availability of the original soundings by a few hours depending on forecast module and source. RAOB, on the other hand, can immediately process the observed sounding file (as available from the Internet or otherwise) and provide a fast, first look at the atmosphere. If RAOB has access to the Internet, the new soundings can be automatically downloaded and processed, depending on data source availability. Automatic, configurable alerts (visual and audible) are also available.

(4) Since most of us live and work between those widely spaced rawinsonde observing sites, RAOB fills the gap with its interpolation function, which can create a complete sounding between any two or any group of soundings. Then, once you have the sounding you need, RAOB can turn that profile into a short-term forecast. If upwind soundings are available, RAOB can automatically use those upwind soundings for time/height advection during forecast creation. If there are no upwind soundings available, RAOB can still create a forecast sounding using classic thermal wind theory logic. RAOB can forecast any sounding. No other skew-T program can perform these functions.

(5) RAOB’s unique severe weather display options make it ideal for those needing fast, accurate storm potential information. Diagrams and text displays can be individually configured to meet user needs. More importantly, individual index and parameter thresholds can be configured to local and seasonal conditions. For example, CAPE thresholds can be adjusted for low, moderate, and severe categories. Theses categories can then be displayed via user-defined colors. The Severe Weather Parameter Table contains forty-eight severe weather parameters that can be configured, which are then automatically consolidated into a simple graphic display for fast analyses.  

Q: Bearing in mind that most chasers operate on a tight budget, what advice would you offer someone who is thinking about purchasing RAOB? Which modules will be most helpful, and why?

J: Tight budgets are getting even tighter these days and that’s why there is now the new RAOB Lite program. It lists for $50.00 and lasts much longer than light beer. You buy it, you own it. You get free technical support, a free upgrade to the next release, and discounts thereafter. The Lite program contains the two most popular data decoders: WMO and BUFKIT. It does not contain the above, advanced interactive features, but it does contain the multi-sounding scanner screen and provides all the essential graphic and text displays for severe weather detection.

If more detail and capability are needed, then an upgrade to the RAOB Basic program is the next step. This gives access to the SHARP, UWYO, and CSV decoders plus many more graphic and text configuration options. Once you have the RAOB Basic program, then any other optional program module can be added. Without a doubt, the most popular optional module is the Analytic module. It provides the advanced severe weather display and text options in addition to many other features.

For those more advanced users, the Interactive and Hodograph module is a must. This turns RAOB into a powerful diagnostic tool. Its interactive capabilities let the user measure the sounding’s “sensitivity” to change. Just the slightest change in surface temperature or dewpoint can make a significant change in the commonly used severe weather indices, such as CAPE, LI, and so forth. Most people use these parameters at first sight; they don’t consider, “What if the surface temperature increased by just one degree?” The results can be dramatic. While sounding sensitivity is very important for lengthy forensic studies, it can also be very useful for quickly evaluating the storm potential of one sounding versus another. Note that this module also contains an advanced hodograph screen which provides detailed analyses of storm motion and related wind shear data.

RAOB has many other optional program modules, each of which is suited for more advanced and special needs. However, one other module that is also useful to storm chasers is the Cross-Section module, which can also produce time-sections of multi-sounding forecast files. One important feature of this module is its meteogram display, which plots the trends of key severe weather indices over the forecast time period.

Q: What advances do you envision for RAOB in the future—say, within the next five years? Any new modules, new capabilities, or perhaps new partnerships in the works?

J: The RAOB factory now operates seven days a week, except for an occasional polka or waltz. Several projects are under construction while others anxiously sit on a prioritized to-do list.

Coming with the next new RAOB release this fall will be the biggest program enhancement since RAOB’s conversion from DOS to Windows. You’re hearing it first right here. The announcement was originally planned for a future American Meteorological Society magazine ad, but the prototype is ahead of schedule and can now be made public. This enhancement is not a new module, but a new screen called the Custom View display. It will be accessible for those with the Basic program at no additional cost.

The Custom View will permit the user to design a personal display screen. You will be able to position and size any combination of sounding and cross-section diagrams for synchronized data displays. Sounding diagrams include skew-T, hodograph, mountain-wave, and soundingram images. The first edition of this screen will only allow placement of graphic diagrams, but later editions will also include text and image objects.

The Custom View screen will satisfy several customer requests at the same time.  It will also be very useful for those with unique wide-screen and vertical-screen monitors. Diagram configuration options will jump from the current 200 or so graphic options to infinite possibilities.

The next major enhancement will be in the area of real-time data processing, especially for non-traditional soundings. These soundings include radiometric, acoustic, sodar, and lidar soundings, which are all becoming more available as these technologies rapidly develop. Although these non-traditional soundings only measure the lower atmosphere, they produce sounding profiles every few minutes or even seconds. This is the wave of the future for weather soundings and will transform how we see the atmosphere, just as Doppler technology accelerated weather radar advances. This data will become absolutely essential to storm chasers—not to mention everyone else.

Beyond these ongoing and planned projects, there are many others on the to-do list, while still others are in the discussion phase. As always, RAOB development responds to customer requests. The more requests received for a particular feature, the faster it becomes reality. New data decoders have the highest priority, since without the ability to ingest and process the data, all else is irrelevant. So, if anyone has a new data or a new need, just contact RAOB.com and let’s talk about it.

Q: Do you chase storms yourself, or was there ever a time in your life when you did?

J: I did get out a few times, but without much success. While stationed at March Air Force Base in southern California, I saw several large dust devils, but they were in hot, dry weather. However, while stationed at my first Air Force job at Offutt AFB in Nebraska, I saw something unusual. At that time I was living in a trailer on a hill—perfect for severe weather monitoring. I saw a pre-tornadic collar or wall cloud. It was large, slowly rotating, and composed of very dark green and blackish clouds.

What an incredible sight! And it was headed toward Omaha. I would have hopped in the car and gone for the chase, but I had to get ready for my weather forecast shift at Offutt AFB. I later found out that an F4 tornado developed and ripped through west-central sections of Omaha on May 6, 1975.

Q: What is your favorite kind of weather? What are some aspects of weather that particularly fascinate you or that you simply enjoy?

J: That’s easy—the awesome stuff. Anything that requires a warning gets my attention. While tornado forecasting is challenging, I found typhoon forecasting particularly exciting. I spent three years on Guam as a typhoon duty officer and loved every minute of it—but that’s another story. Typhoons and hurricanes are the king of the hill when it comes to weather phenomena. They even spawn tornados. Regarding a more subtle, weather-related event, I’m still trying to get my first glimpse of the elusive “green flash.”

———————–

There you have it: RAOB as discussed by its inventor. If this post has a somewhat commercial tone to it, take it in stride. RAOB is John’s business, and obviously he’d like to sell his product. But it’s an absolutely amazing product because it began, and continues, first and foremost as one man’s passion. Having used it for a couple years, I wanted to find out more about its development and its developer and offer my storm chasing and weather readers an article that would be both interesting and useful. The initiative has been my own, and I’ve made no money out of the effort.

While links aplenty have been furnished above, I’ll conclude with one last, handy link to the RAOB homepage in case you’d like to find out more.

In Tribute to The Beatles

One of the marvels of YouTube is its videos of classic rock bands performing in the studio or in concert. Hendrix, Janis, The Who, Mountain, Jethro Tull … you can find them all, alive and kicking, in the prime of their youth and at the peak of their creative spark.

But among the icons of rock, one band towers above all the rest. In my estimation and that of many others, The Beatles were the progenitors of modern rock music, the importers of a British influence that took R & B in a different, electrifying direction. They were the watershed from which many streams have flowed. There may have been better instrumentalists in their day, but collectively the Fab Four were sheer genius.

Fortunately, The Beatles are well represented on YouTube. If I’ve seemed a bit effusive in my praises of them here, it’s because I just finished watching clips of the Beatles featuring two very different songs.

The first is an odd, artsy, vaguely disturbing video of the band members set in a dreamlike scenario filled with strange imagery. It’s an appropriate visual counterpart for the dark, richly textured John Lennon tune “Strawberry Fields Forever,” whose quirky, impressionistic lyrics, colorful orchestration, and shifting moods practically defined the psychedelic sound of the late 1960s. Whatever you consider “Strawberry Fields Forever,” it’s not rock and roll. It’s far too sophisticated for dance music. It is, in the parlance of those times, “a vibration,” something to be listened to, felt, and experienced.

On the other end of the spectrum is the video of the Beatles in the studio recording the visceral “Helter Skelter.” The tune is sheer, relentless energy. If “Strawberry Fields Forever” set the tone for psychedelia, “Helter Skelter” lit the fuse of heavy metal. I’d never have thought it of Paul, but seeing and hearing is believing. The man was a metal head before the term ever got coined. Small wonder that bands such as Aerosmith and Motley Crue covered the tune in their live concerts.

Speaking of which, I watched a number of other YouTube clips of various bands performing “Helter Skelter”: Aerosmith, Motley Crue, Bon Jovi, U2, even an older Paul McCartney. All of these groups offered some truly high-power performances. But the original Beatles version electrifies like nothing else. Maybe part of its impact lies in the simply seeing the guys playing together on the video and realizing just how much energy they generated. Whatever the case, the effect is incendiary.

The band’s impact continues to reverberate decades after their breakup in late 1969. While some of the commentary that attends the YouTube clips is what you would expect, I nevertheless find it gratifying to see how much reverence, if not outright adoration, is accorded the Beatles by so many listeners who weren’t even born until twenty and even thirty years after the recordings.

My apologies, by the way, for not including links to the YouTube videos mentioned in this post. Regrettably, such videos have a poor shelf life, and I consider it pointless to include links that are almost certain to wind up broken within a year or so.

I have no more to say about The Beatles tonight, largely because there is so much to say about them that it’s best to stop here and, um, let it be. It is late and I’m tired. Good night.

Ugh

Snots, sneezes, and overall feeling like crap. Nuts to writing anything.

Practicing “Giant Steps”: Static and Chord Tone Sequences

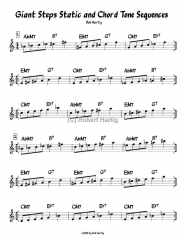
Here are some more exercises on the Giant Steps cycle. (Click on the image to enlarge it.) While it might not be immediately apparent, the linear patterns shown here are actually a continuation from my previous post on isolating V7s in the cycle. Note that the V7 chords are still spotlighted by emphasizing them with quarter notes, which are led into by the preceding grouping of eighth notes. Think of the dominant harmonies as target tones preceded by a walk-up.

In these exercises, I’ve elected to focus on the treadmill-like cycle of Coltrane changes rather than the full eight-bar A section of “Giant Steps.” As is typical of so much of the practice material in my posts, what you’re getting here comes straight from my own current explorations and discoveries in the woodshed

Don’t be cowed by this post’s heady subtitle, “Static and Chord Tone Sequences.” I’m just not sure how else to describe this material. The goal I’m after is to work with linear sequences that will drill the shifting tone centers of Coltrane changes into my fingers. (Geeze, that still sounds murky as all get-out. Oh, well. Deal with it.)

Since I’m an alto sax player, I’ve written these exercises in the Eb transposition. If you play a Bb or a C instrument, you’ll need to transpose accordingly.

Exercise one proceeds through the entire Giant Steps cycle in three bars. The first three-bar cycle starts on Ab; the second, on E; and the third, on C. In each series, I’ve kept the first note of each measure as static as possible, shifting it by just a half-step in the third measure to accommodate the change in key.

In exercise two, the harmony continues to repeat itself (i.e. AbM7 to B7, back and forth) while the starting tone for the eighth-note groupings shifts, progressively, from the root to the third to the fifth.

In both exercises, pay attention to which target tones you arrive at in the dominant seventh chords.

And that’s enough of me talking. Dig in, engage your analytical thinking along with your fingers–and, as always, have fun!

Oh, yeah–if you enjoyed this post, please check out my many other articles, practice exercises, solo transcriptions, and video tutorials for improvising musicians.

Practicing “Giant Steps”: Isolating Dominant Sevenths

I’ve recently been focusing on the Giant Steps cycle during my practice sessions, with the thought that at some point soon, once I’m ready for prime time, I’ll record myself. It seems only right that a guy with the audacity to write a book of Giant Steps licks and patterns ought to furnish some evidence that he can actually play the tune. So I’ve been getting myself up to snuff.

But it’s one thing to play “Giant Steps” and another thing to play it creatively. As you know if you play or have attempted to play the tune yourself, the A section in particular is a challenge. So I was pleased with the breakthrough of sorts that I experienced the other night, which I continued to explore during this evening’s practice with good results.

In the changes to “Giant Steps,” bars 2–3 and 5–6 alternate tonic major chords with dominant seventh chords in a framework of rapid modulations through three key centers spaced a major third apart. For the Eb alto sax, the first two bars proceed thus: AbM7 B7 / EM7 G7; and bars five and six are as follows: EM7 G7 / CM7 Eb7. You can distill all of that into a single cycle, thus: AbM7 B7 / EM7 G7 / CM7 Eb7, after which the cycle repeats itself.

I’ve tended to focus on the major chords–in other words, the first chord in each measure. But I’m finding that spotlighting the dominant seventh chords is helping me to improve my command of the changes. For practice purposes, my approach–or at least, part of my approach–is to omit the major chords entirely, forcing me to think exclusively about the dominant chords and what I want to do with them. Right now I’m keeping it simple, sticking with essential chord tones. In a while, I’ll start altering upper extensions and probably incorporating tritone substitutions. But first I want to get basic chords drilled into both my fingers and my mind.

On this page I’ve included a few simple patterns that I’ve been working with. (Click on the image above to enlarge it.) They’re nothing fancy, and they’re not intended to be. But if you work with them when you practice “Giant Steps,” I think you’ll find that they make you think in a different way which will help you wrap your mind around the changes better.

These patterns are just to get you started. I encourage you to make up your own patterns, and don’t be shy about using wider intervals such as fifths and sixths. I should add, at the risk of stating the obvious, that you should transpose the patterns according to the dictates of your instrument: up a minor third for flute, piano, and other concert pitch instruments, and up a perfect fourth for Bb instruments such as the tenor sax and trumpet.

Practice hard and have fun!

Book Review: Weather Analysis and Forecasting Handbook by Tim Vasquez

I initially became acquainted with Tim Vasquez’s books a good ten or so years ago at my very first severe weather conference at the College of DuPage. Tim was sitting at a table selling, among other things, his Weather Forecasting Handbook. I bought a copy and began chewing on it, and I have continued to do so ever since over the years. There’s a lot of essential information packed into the 204 pages of the old “Purple Book.” (Tim’s books are known colloquially by the color of their covers.)

That book took me deeper into a world of meteorological concepts that I was only beginning to become aware of, ones that storm chasers need to know. My brain not being the kind that readily absorbs such stuff by reading alone, it took me a long time and many read-throughs to grasp some of the arcane principles, language, and tools that are integral to making one’s own forecasts and selecting target areas. I still have a few things to learn–okay, plenty of things–but much of the material Tim covered is now familiar to me, and I apply it regularly.

Ragged and torn from long use, my old copy of Tim’s book sits beside me now as I write. Next to it is a brand-new copy of its heir-apparent, the Weather Analysis and Forecasting Handbook.

While anyone familiar with the old book will recognize much of the material, the new Purple Book is far more than just a makeover. At 260 pages, it provides considerably more information, all of it reflecting current research and technology. This is weather forecasting as it is today, not as it was a decade ago. Indeed, so much new material has been introduced; so much of the pre-existing text has been revised and expanded; the illustrations have been updated and extended to such a degree; and the content has been so thoroughly reorganized overall, with an eye on taking the reader beyond concepts to analysis and forecasting, that the Weather Analysis and Forecasting Handbook is for all intents and purposes a new book, not just an updated edition. And, I might add–and I say this rather grudgingly, having cut my teeth on the old handbook–this new volume is a more comprehensive and helpful resource than its venerable predecessor. There is just a lot more to this book, and it’s all presented in a well-thought-out fashion.

Main Content

One significant change in the Weather Analysis and Forecasting Handbook is the organization of its content. As does the previous book, this one begins by introducing foundational physical concepts such as mass, force, pressure, temperature, the Coriolis force, geostrophic wind, vorticity, and so forth.

The second chapter on observation also appears largely familiar, though it keeps abreast of current practices. However, the previous treatment of clouds is only lightly addressed because the subject is given an entire section of its own in the book’s appendices.

Beginning with chapter three, the changes become pronounced. Here is a very abbreviated overview of the book’s structure from this point:

Chapter three: Thermodynamics–Deals with instability and familiarizes the reader with atmospheric soundings. Here is where you’ll learn how to read and interpret that essential forecasting tool, the skew-T/log-P diagram.

Chapter four: Upper Air Analysis–Taking a top-down approach to forecasting, this chapter introduces constant pressure charts, long waves and short waves, divergence and convergence, jets and jet streaks, and other atmospheric processes and influences from 100 mb down to 925 mb.

Notably missing is a structured introduction to charts for specific pressure levels, such as the 500 mb height map. That discussion has been shifted to the appendices. Instead, chapter three focuses on the various factors that the maps depict, and the book makes such liberal use of the different maps by way of illustration that the reader gains familiarity with them through osmosis. My guess is, Tim believes that by helping readers understand upper-air dynamics and processes, the significance and use of the various maps will become apparent through real-world examples.

Chapter five: Surface Analysis–Learn how to read a surface chart, get a basic grasp of air masses, and discover the importance of various boundaries, from cold and warm fronts to drylines and outflow boundaries.

Chapter six: Weather Systems–This chapter groups together concepts from several chapters in the old forecasting handbook. The presentation is logical and fresh. Subjects covered include all-important baroclinic lows and highs, barotropic systems, arctic air outbreaks, and winter weather systems.

Chapters seven and eight deal, respectively, with satellite and radar. Suffice it to say that they are required reading. Since both remote-sensing tools are visual in nature, plenty of pictures are provided to illustrate patterns, systems, outflow boundaries, velocity aliasing, severe weather signatures, and so on.

I’m a bit surprised to see not a single screen grab of a velocity couplet, either in the radar chapter or in the ensuing chapter nine on convective weather. However, velocity products rely highly on a full-color format and don’t lend themselves easily to this book’s black-and-white images. Tim points this out later in figure 9-6, where he writes, “Typical NEXRAD color schemes do not reproduce well in monochrome books.”

Importantly, the chapter on radar discusses the new dual-polarization technology that is being implemented nationwide at the time of this review. Dual-pole is a huge development in the NEXRAD system, probably the biggest stride forward since the deployment of NEXRAD itself.

Chapter nine: Convective Weather–For aspiring storm chasers, this chapter will likely be the Holy Grail of the book. Besides dealing with the ins and outs of thunderstorms, from single-cells to supercells to mesoscale convective systems, this chapter discusses storm-relative winds and introduces another indispensable forecasting tool, the hodograph. Chapter nine moves on to talk about tropical systems including hurricanes.

Chapter ten: Prognosis–This last chapter in the main body of the book deals with the actual process of forecasting. Readers will at this point have recognized that Tim is a strong advocate for understanding not merely how the atmosphere is likely to behave, and where, and when, but also why. Here he discusses the four-part forecasting process. He emphasizes the importance of a hands-on approach to analysis while at the same time recognizing the key role of numerical models, the application, strengths, and weaknesses of which he discusses at length. The chapter concludes with a brief overview of ENSO and teleconnection patterns.

The entire book is amply illustrated. Barely a page exists that doesn’t include some kind of black-and-white chart, map, or photograph. These visual supplements are clear and immensely helpful, to the extent of being integral to understanding much of the written content.

To round things out, the book is peppered with sidebar commentary ranging from the informative, to the philosophical, to the historical, to the humorous. For instance, on page 31 I find a table of NATO color codes; page 57 furnishes a thumbnail discussion of long waves; a lengthy entry on page 120 describes five different empirical forecast techniques; and on page 166, there’s a wry commentary on how to tell whether a tornado is forming using the “thumb tab” approach of the Field Guide to North American Weather.

Appendices

This section is an informational gold mine. Strangely, it’s not even mentioned in the table of contents, so I’m going to give you the breakdown here:

Appendix one: Forecaster’s Guide to Cloud Types–Photos and descriptions of major cloud types, including brief discussions of each one’s significance from a forecasting standpoint.

Appendix two: Surface Station Plots–What all those numbers and symbols mean.

Appendix three: Surface Chart Analysis Procedures–Brief guidelines for doing surface analyses.

Appendix four: Upper Air Station Plots–Similar to the second appendix, except applied to upper air plots.

Appendix five: Upper Air Chart Analysis Procedures–This is about as close to an overview of specific pressure maps as this book provides, which it does from an analysis perspective. This appendix divides into three short sections on upper-, middle-, and lower-tropospheric charts. Between them, they provide insights on the significance, use, and analysis of upper-air maps from 100 millibars all the way down to 925 millibars.

Appendix six: An Isoplething Tutorial–Veteran forecasters invariably are strong advocates of hand analysis, and Tim is a prime example This appendix shows you how to get started at creating your own hand-analyzed weather maps.

Appendix seven: Conversions and Symbols.

Appendix eight: Instability Index Summaries–Brief discussions of the more commonly used forecasting indices such as CAPE, CINH, lifted indices, the energy-helicity index, and the SWEAT index. A couple of these tools–BRN shear and storm-relative helicity–aren’t in themselves related to instability; however they’re so widely used in severe weather forecasting that they require discussion, particularly since they’re factored into such true instability indices as the EHI, STP, and Bulk Richardson Number.

Appendix nine: Types of Thermodynamic Diagrams–Brief discussions and graphic examples of the skew-T/log-P, emagram, Stuve, pastagram, aerogram, and tephigram.

Appendix ten: Blank Diagrams–Reproducible blank skew-T and hodograph.

Appendix eleven: Observation Format Overview–For the incredibly geekish, a quick reference guide to the most commonly used weather-reporting formats: METAR, SYNOP, and TEMP (radiosonde code).

Additional appendix materials without assigned section numbers include the following: suggested reading, software, educational websites, government weather agency websites, and top-ten weather myths.

Three Recommendations


Let me preface my following few critiques by saying that this is a fantastic book. The author is both a veteran storm chaser and an educator, and that combination has inspired him to create a practical resource that is both accessible to lay-persons and helpful to operational forecasters. Storm chasers and anyone who wants to develop skill at weather forecasting would do well to put it in their library.

This said, I have three comments that Tim may wish to consider at some point:

• I liked the old handbook’s quick, specific introductions to the 200/250/300 mb, 500 mb, 700 mb, 850 mb, and surface charts. The overviews of those charts gave me–at a time when I was a complete novice and needed weather knowledge delivered to me in brick form–an instant, systematized reference to the constant-pressure maps that are such essential tools of the trade.

Granted, entire books have been written about weather maps, including Tim’s own Green Book, the Weather Map Handbook. The new Weather Analysis and Forecasting Handbook is obviously not intended to fill such a role. But perhaps in the appendix section, the fifth appendix could be fleshed out a bit by providing a top-down sampling of CONUS maps for a single date/time. That way those unfamiliar with upper atmospheric maps could see how, say, March 13, 2011, at 1200 UTC mapped out at 300 mbs, 500 mbs, 700 mbs, 850 mbs, 925 mbs, and on the surface.

• Granted the limitations of trying to translate something as color-dependent as radar velocity products into a gray-scale format, there may nevertheless be a benefit to making the attempt. I say this because the ability to recognize storm-relative velocity couplets is so critical in storm chasing. While the illustrations on page 145 (figs. 8-2a–f) do a good job of conveying the general idea, there’s nothing like real-life examples. Perhaps such examples could be included in the future, whether directly in the book or possibly as a link to a page featuring radar screen captures on Tim’s Weather Graphics website.

• A quick, easy-reference glossary of essential terms would be a welcome addition.

With these three suggestions on the table for Tim to consider in his next edition, I unhesitatingly recommend this book. It’s superb, a labor of love by one of the gurus of operational forecasting who clearly cares a great deal about helping others learn the ropes.

Some months back, I reviewed Tim’s other recent publication, Severe Storm Forecasting. It’s another excellent resource for storm chasers in particular, covering some of the same ground as this book and expanding considerably on the subject covered in chapter nine, “Convective Weather.” Good as that book is, though, Weather Analysis and Forecasting provides the more complete, well-rounded picture. Be forewarned: it’s not a book you will read and absorb in one sitting. It is chewy material that will require you to approach it analytically and patiently. This is a resource you will pull off the shelf again and again, whether to re-engage with material you’re still trying to grasp or to refresh yourself on concepts you’re already familiar with.

Purchasing Information

  • Weather Forecasting and Analysis by Tim Vasquez, 260 pages.
  • $29.95 plus shipping, available from Weather Graphics.

NOTE: This is a non-paid review. I’ve written it as a service to my readers and to Tim because, having read the book, I’m convinced of its value for storm chasers and severe weather buffs.

The Passing of Andy Gabrielson

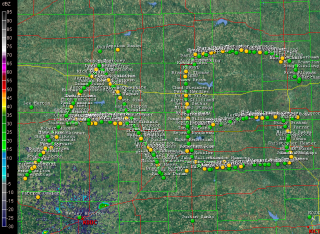
I returned home from practicing my sax an hour or so ago, dipped into Facebook, and was stunned to learn of the accidental death of Andy Gabrielson. The radar is lit up tonight with scores of Spotter Network icons spelling out the initials “A G” across the state of Kansas in his honor.

I’m just sickened by the news of Andy’s passing. I never met him, but like many storm chasers, I’ve seen and admired his work and his dedication. He was just 24 years old, barely more than a kid, but already he had attained an impressive track record. If storms were firing anywhere in the the continental United States, Andy’s SN icon was sure to be there. I am saddened to think that henceforth it will be missing.

But as much as the loss of Andy will be felt by the storm chasing community, our loss is nothing compared to that of his family. One idiot drunk driver headed the wrong way down the Turner Turnpike in Oklahoma has left a young wife without a husband and little girl without a dad. It is sad beyond belief. To the Gabrielson family, if you chance upon this post: I am so sorry. My thoughts and prayers are most truly with you.

An Interview with Shane Adams, Part 2: Thoughts on Target Selection, Memories of the Greensburg Storm, and Reflections on Top Three Chases

In Part One of my interview with veteran storm chaser Shane Adams, Shane recalled his formative years as a chaser in a simpler time when laptops, mobile data, and the media hadn’t transformed the landscape of storm chasing.

Part Two begins with several questions that deal with more pragmatic matters of forecasting and target selection. From there, Shane recalls his experience with the deadly May 4, 2007, Greensburg supercell. It’s a unique perspective on the storm in its post-Greensburg phase as it continued to spin off massive, violent wedges, and Shane’s account includes a haunting encounter with Macksville police officer Tim Buckman shortly before he was fatally injured by one of the tornadoes.

Finally, Shane reflects on the top three chases of his career and tells why he considers them so.

Question: I just finished listening to an interview with David Hoadley on the High Instability podcast, and I was struck by the similarity between some of what he had to say and your own comments [in response to my last question in Part One]. Realistically, chasing continues to evolve; yet I resonate with your gratitude for having come up in a simpler time when there was nothing to detract from the supreme value of the storm and the sky. I’d imagine—correct me if I’m wrong—that today you use at least a laptop and GR3 on your chases. But I get that you’re a minimalist at heart. Let’s talk about what a chase looks like for you these days. First, what is your process for forecasting? What things do you look for in picking your target?

Shane: These days, I use the same computer models all other chasers use. Within that, of course, there are several different sources. Personally, I use the College of Dupage computer model website. The reason why is, most model pages use CONUS maps. I don’t like CONUS maps because they make individual states and regions too small for detailed analysis in my opinion. CoD uses regional maps, which are much easier to analyze down to the mesoscale and even microscale level. It’s important for me to be able to recognize a specific area within a state while looking at model data, so I can overlay in my head the actual spot where I believe all the ingredients will come together. Looking at a CONUS map, I might be able to say, “Yeah, southwest Oklahoma looks good,”  but I can’t tell exactly where in southwest Oklahoma I need to be. The difference between a career day and a bust can be as little as twenty or thirty miles, something that is impossible to pinpoint using CONUS maps. So definitely College of Dupage is my forecasting lifeblood. When their site is down, I am not happy LOL.

As far as a target is concerned, again, I’m pretty much like everyone else. You want the basic four of course: moisture, instability, wind shear, and a source of lift. I tend to gravitate toward instability, with slightly less attention to wind shear. I’ve not had much luck chasing highly dynamic systems with low instability, so those are a big turnoff for me when looking at a forecast. Also, those type setups typically have very fast storm motions, making chasing more difficult. With more focus on instability and less on wind shear, I try to find an area with the most explosive potential for upward motion in a place where storm speeds won’t be as fast (lack of intense shear). Of course this dream scenario rarely unfolds in reality as often as I’d like, but in any chase setup, I will always first target the area of greatest instability and fine-tune from there based on other parameters.

Q: If you were to head out into the field without the benefit of Internet, equipped only with your morning forecast and the knowledge you’ve gained over the years, how would situational awareness inform your decisions as the afternoon progressed? In other words, how might simply looking at the sky or observing changing conditions tell you that you’re in the right spot—or, conversely, that you need to move?

S: One built-in advantage of cutting your chasing teeth in central Oklahoma is, 99 percent of the time the dryline is west of you. This means that you wake up in the warm sector on most days and simply have to drive west until the clouds thin out.

Drylines are marked visually by a sharp decrease in cloud coverage, vertical height, and base level. Bases will rise, tops will flatten, and the overall number of clouds will decrease as you approach the dryline. This was one of the first lessons I learned; the scenario was nearly automatic each time I chased because I never woke up on the dry side of the dryline.

Warm fronts are perhaps even more pronounced visually, as north of them on many chase days, there will be a solid overcast of low clouds. These clouds begin to thin as you near the warm front, and then as you move south there are fewer and fewer clouds until you’re in clear sunshine—plus whatever early-bird towers are trying to build in the warm sector.

My targets usually put me near either a dryline or warm front, so my biggest visual clues are simply watching how clouds behave.

Q: Storms are firing and you’ve got multiple options. Without using radar, how would you determine which storm you’ll go after?

S: Usually when faced with having to choose from multiple storms, it’s right after initiation, and every storm has the same potential to become tornadic. Because of this, I almost always opt for the storm I have the best position or approach angle on. Sometimes it works, sometimes it doesn’t.

In other situations where you’re a good distance from the storms and they’re in different directions from you, you have to analyze the situation more closely based on storm history and the immediate environment. If, for instance, I’m thirty miles south of the triple point, and I have a storm north of me right on the triple point and another one forty miles south of me, then I have to consider certain things and do a quick pro/con list for each storm in my head: the north storm is closer, but it’s moving away … the south storm is farther away, but it’s moving towards me … but the north storm will have better helicity sitting right on the warm front, so there’s a better chance it could produce a tornado … but it could also cross the warm front into the cool side and become elevated before I get to it … so the south storm seems like the way to go … but I’m going to have to punch through the entire core to get a view … these are not easy decisions, and they must be made quickly. I’ve been right, I’ve been wrong, but the worst situation is when you’re indecisive and end up missing both because you took too long to commit to one or the other. I’m much better off just sticking to my target, driving there, and letting the situation unfold … instead of just driving to a general area and waiting until after initiation to pick a storm.

Q: You were among those who chased the Greensburg storm. Describe your experience.

S: In all reality, we busted on this day. By dusk, we were well north of the Greensburg storm as it developed, and had already thrown in the towel and stopped for food. Because I chase to get good tornado video, I always quit after dark unless I’m already on a tornadic storm. So we’d been sitting in the Great Bend Pizza Hut drowning our sorrows with a large Meat Lover’s and Bud Light.

On a whim, Mick Ptak, the friend I was chasing with, had decided to bring his laptop inside “just in case” to watch the radar. We’d never done this before, so the fact that he’d chosen this night was, in hindsight, very lucky and ironic; if he hadn’t done so, we’d have sat there eating and missed the entire event. Or even worse, been in the path of more deadly storms well after dark.

Somewhere during beer number two, we both glanced over at the radar. Mick had been running a velocity loop, and the couplet we were looking at was off the charts, like nothing we’d ever seen before. We immediately went into chase mode, with Mickey grabbing all the gear while I ran to the counter to pay for the meal. I asked if the tab was below $20, and when the person said that it was, I just threw a twenty at them and ran out the door.

We raced south while listening to live reports coming over NOAA radio. It was obvious something terrible had happened in Greensburg, although neither of us at the time had any idea of the magnitude.

We got to Pratt, which is about thirty miles east of Greensburg, and turned west. We stopped near Haviland, where we began our actual “chase” of the Greensburg storm. I remember scores of emergency vehicles screaming by us for several minutes, all headed west from Pratt. The scanner was alive with constant chatter regarding the disaster that had just happened. We were using the velocity loop on radar as our main source of info, because the lightning wasn’t helping out as much as we needed. The first of three giant tornadoes we would observe that night loomed to our northwest, buried in darkness and probably precipitation. We were sure we were looking at a tornado, but it was so big and so hard to see, it was impossible to make it out clearly (it would be partially revealed in a capture from my video). The inflow was so incredible, I had to wedge myself against the open car door space while leaning against the door to keep it from closing on me. We moved back east and then north once the storm started moving further away.

Watching the radar, we were noticing alarmingly large spaces between mesocyclone occlusions. Not only were these couplets incredibly powerful, they were also unbelievably huge. It made sense that the “handoff” distance between mesos would be greater than normal as well, because the mesos themselves were so unusually large. Normally, five miles southeast of an ongoing meso/tornado is a reasonably safe distance, but not tonight. We kept a minimum of about seven to eight miles between us and the tornadoes for fear of being run over by the next cycle jumping toward us. Unfortunately, later that night, a local LEO would become an example of how these large-span meso jumps can be lethal.

As we continued north, we met a car coming south, frantically flashing its lights. At this point, with this storm and what it had already done, we weren’t taking any chances, so we turned around and headed back south. No sooner had we done so than Mick said, “There’s a huge wedge back there!” I stopped the car and we jumped out. I hadn’t yet seen it, but I could tell by Mick’s reaction that it was big. A few more seconds passed by, then a big flash of lightning lit up one of the largest tornadoes I’ve ever seen. “Whoah, I see it!” We held our ground and watched this huge wedge tornado through intermittent lightning flashes for a couple of minutes, then continued further north.

We stopped a few miles south of Byers, and a police car pulled up beside us. We didn’t know it at the time, but the driver was Officer Tim Buckman of the Macksville police department, a neighboring town to Byers about ten miles north and slightly west. We told him about the large tornado we’d been seeing off and on for the previous ten or so minutes, and he was already aware of it. He continued on ahead of us, and we followed him into town. Once we arrived in Byers, we saw Officer Buckman pulled over at the fire station, talking to a few firemen/spotters. As a courtesy, we stopped and asked him if he minded if we continued on ahead to chase the tornado. He said we could, but it was “at your own risk.” We told him we understood, thanked him, and drove north of town about a mile, where we stopped.

We continued to get glimpses of the tornado, and after a while, Officer Buckman drove past us. He went about a mile or so north, then turned west. The tornado was well off to our northwest, and the area he was driving into would’ve been a prime spot for the next tornado if the storm recycled. I remember thinking, as I videotaped his flashing red and blues moving slowly off toward the large tornado in the distance, “I wouldn’t go that way.”

As Tim Buckman’s emergency lights faded off into the darkness to our north-northwest, we became focused on a new area that was north of us, but closer than the previous tornado had been. Matching up what we were seeing to the radar, we were convinced this new area was the next probable tornado, southeast of the now dissipating tornado near Macksville, some ten miles to our north-northwest. We stayed put where we were, partly because we were almost out of gas at this point, but mostly because we were too spooked to get any closer. After a few more minutes, another large tornado became partially visible with lightning strikes. The eastern edge was buried in rain, but the west side of this monster loomed quite clear, a solid wall of black. We sat and watched this tornado, which was south of St. John, for maybe five minutes until we could no longer make it out. After that, we decided we’d call it a night, because we had another chase looming the next day, and we’d need some rest (though we hardly got any).

I don’t know why we even thought we could, but we drove back to Pratt, and managed to get a room at the first hotel we stopped at. I spent all night going over my video, finding bits and pieces of tornadoes within the lightning strikes. I wrote a report on Stormtrack while the local television news was showing us the first shots of the Greensburg monster we’d seen—incredible. The sirens never stopped all that night, with constant emergency vehicles driving to Greensburg and driving back from there with injured. It was a very dark and brooding night, probably the most unsettling night of my chase career. Since then, I’m much more wary about after-dark chasing. I was never very interested in nocturnal chasing, because night-time video is rarely worth the effort in my opinion. However, the significance of this event made the endeavor very worthwhile, and in the process, we managed to get video of tornadoes that nobody else did. What at first seemed like a curse actually became a blessing of sorts; we’d missed the marquee tornado of not only the event, but the entire year—but we’d managed to pick the storm up where almost everyone else had lost it, getting trapped by the devastation in Greensburg. The result was observation and video documentation of large tornadoes that no other human eyes ever found.

A few days later, unfortunately, we learned that a Macksville police officer had been killed by a tornado east of there. As it turned out, the officer killed was the one we’d spoken to that night during the Macksville tornado. He had made his way through rural areas just southeast of his hometown to get back to the highway east of Macksville so he could observe the large tornado threatening his community. Tragically, the last tornado we saw, from the same spot where we last saw officer Buckman driving northwest towards the Macksville tornado, formed south of his position, and struck him as he moved east on highway 50, critically injuring him. He would succumb to his injuries a few days later. We were likely the last ones to ever see him before this tragic event.

Q: Granted this may be a hard question to answer, but what has been your most outstanding chase, and what made it so?

S: I measure greatness in a chase by multiple factors: number of tornadoes seen, quality of tornado video, historical significance of the event, and overall aesthetic/sensory/spiritual experience. Even with that, I cannot choose just one day. So using the formula I described just now, I’ll try to narrow it down to just one event that fits each category.

Number of tornadoes seen: Even though it’s tied for second all-time for the most tornadoes I’ve seen in one day, I would have to give the nod for most tornadoes to May 29, 2004. Great video, but what stands out most about this day for me is the sheer number of visible tornadoes. Every size and shape imaginable, with the most incredible display of tornadic behavior I’ve ever witnessed: Multiple tornadoes merry-go-rounding about the parent mesocyclone. Tornadoes zigging, zagging, and doing full circles. Absolutely incredible!

Quality of tornado video: This category belongs to June 12, 2004. The infamous “glowing” Mulvane tornado steals the show from this event, but all the tornadoes that day were very photogenic, and I was able to capture incredible video of them all. This day is the bar for what I expect to bring home on video every time out. Mulvane was the first tornado I ever heard the roar from.

Historical significance: If we’d actually seen the Greensburg, Kansas, tornado that night, this would’ve likely been my number-one. However, May 3, 1999, remains at the top of this category. Many firsts happened for me that day: first F5 tornado, first 3+ tornado day, first double-digit tornado day (ten tornadoes), first up-close tornado encounter (less than a half-mile), and unfortunately, my first killer tornado.

I almost doubled my career total on this day. I had been chasing a little under three years at the time, and though I’d seen some tornadoes, I had never seen a day even close to this. Despite the dark cloud that hung over this event because of the of the human tragedy it brought, yet for me as a chaser, the sheer magnitude of what we’d seen and captured on video was almost overwhelming. That whole week was surreal: getting calls for interviews, having television crews at our apartment taping shows, the whole nine yards. The week after May 3, 1999, was as close as I would ever come to money and fame as a chaser. I appeared on television in both America and Germany (the German show actually aired first, so my TV debut was international LOL), and made $2,100 from video sales. There were no brokers in 1999. I had to fight those bloodthirsty wolves on my own, and in the end, despite the fact that I won the war, I decided the battle scars just weren’t worth $2,100. My television and video sales career began and ended that week.

Overall aesthetic/sensory/spiritual experience: Hands-down, this category goes to October 24, 2010. This was a day that brought back that old “chase first, forecast second” philosophy from my early years, but only because of my laziness. The only reason we even left the house that day is because Bridget Geaughan, my girlfriend/chase partner since 2008, was watching a storm explode just east of our apartment. We’d spent the previous two days busting on setups that, in my opinion, had looked better than this day. I wasn’t about to waste my Sunday on a third consecutive goose chase. However, Bridget pushed for us to chase and I caved.

Once we got out on the road after the initial storm she’d seen, it was obvious we’d never catch it. By now I was fully into chase mode, and I figured our only hope was to start heading southeast, cross the dryline, and hope like hell something new formed to our southwest. The plan worked to perfection, and we encountered the tornado of our lives in Rice, Texas. This chase has been well-documented in chasing circles, mostly because Bridget live streamed almost the entire lifecycle of the tornado. I’ll never forget looking up at the top of the funnel as it was in a near-steady-state, watching how the base seemed to get pulled into it like a bathtub drain. It was a view I’d not had before and haven’t seen since, but one I could get used to. Probably a once-in-a-decade type experience, maybe once in a lifetime.

———————–

Thanks, Shane, for an informative, thoughtful, moving, and overall terrific interview! To those of you who’ve read this far: check out Shane’s blog, Passion Twist. It’s aptly named–filled with insightful, detailed, and well-written chase logs; packed with photos; and stamped with Shane’s unquenchable love for chasing storms.