Welcome to 2014! I’m going to refrain from writing the typical New Year’s Day stuff here, having already shared my greeting and reflections on Facebook. Instead, I want to share one of the cool new things this New Year has brought in.
For some time now, deep in a hollow tree, John Shewchuk has been hard at work, and now, at last, he has rolled out something that is sure to make your mouth water: worldwide data maps for his RAOB software.
Okay, so it’s not a new cookie and John is not a Keebler elf. What he is, is the creator of the world’s most powerful and versatile atmospheric sounding software, which, thanks to John’s ongoing quest for excellence, keeps getting better all the time.
I am an unabashed RAOB fan, and I’m far from alone. John’s clients, both government and private sector, are legion and worldwide and firm believers in the phenomenal firepower of John’s brainchild. I am probably the humblest and least sophisticated of the bunch, not being a weather researcher or an operational forecaster but merely a layman with an avid interest in storm chasing. I purchased the core software several years ago along with a number of the modules, and I quickly realized that the capabilities of RAOB far outstripped my knowledge of the atmosphere, to say nothing of my technical expertise. I will add that I’ve learned a bit since then, particularly in the first area, thanks in part to RAOB, whose commonsense design has made the meteorological insights that soundings have to reveal easier to access for even a non-tech such as me.
And that underscores what is, in my book, one of RAOB’s most glowing attributes: its ease of use. I don’t have to be a geek in order to make it go. It’s much easier and faster to use than Bufkit, which, though feature-rich and free, I never could figure out. And now, with the addition of worldwide data maps, the RAOB user interface becomes even more intuitive and convenient.
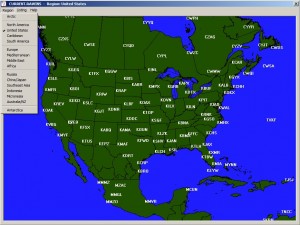
 Here is an example of one of the maps. As you can see from the pulldown menu, there are other options which, altogether, cover the entire globe, including the polar regions. They are the latest improvement to the version 6.5 beta test and apply only to WMO soundings, not forecast soundings such as GFS or NAM. The latest update to the maps completes phase 1 of the mapping project. A recent newsletter stated that “phase 2 will enable creation of cross-sections by just drawing a line across the data maps. ” That will be an immensely useful feature for setting up spatial (versus temporal) cross-sections.
Bottom line: Big kudos and thanks to John–who, by the way, works out of his home in Matamoras, Pennsylvania, not in a hollow tree. Sorry to disillusion you. But if you’re a storm chaser or a weather buff, what he turns out goes far beyond anything the Keebler elves ever dreamed of.
I should add, this is neither a paid nor solicited review. I have written it strictly as a service to fellow storm chasers and because I love John’s work.

