Book Review: Weather Analysis and Forecasting Handbook by Tim Vasquez

I initially became acquainted with Tim Vasquez’s books a good ten or so years ago at my very first severe weather conference at the College of DuPage. Tim was sitting at a table selling, among other things, his Weather Forecasting Handbook. I bought a copy and began chewing on it, and I have continued to do so ever since over the years. There’s a lot of essential information packed into the 204 pages of the old “Purple Book.” (Tim’s books are known colloquially by the color of their covers.)

That book took me deeper into a world of meteorological concepts that I was only beginning to become aware of, ones that storm chasers need to know. My brain not being the kind that readily absorbs such stuff by reading alone, it took me a long time and many read-throughs to grasp some of the arcane principles, language, and tools that are integral to making one’s own forecasts and selecting target areas. I still have a few things to learn–okay, plenty of things–but much of the material Tim covered is now familiar to me, and I apply it regularly.

Ragged and torn from long use, my old copy of Tim’s book sits beside me now as I write. Next to it is a brand-new copy of its heir-apparent, the Weather Analysis and Forecasting Handbook.

While anyone familiar with the old book will recognize much of the material, the new Purple Book is far more than just a makeover. At 260 pages, it provides considerably more information, all of it reflecting current research and technology. This is weather forecasting as it is today, not as it was a decade ago. Indeed, so much new material has been introduced; so much of the pre-existing text has been revised and expanded; the illustrations have been updated and extended to such a degree; and the content has been so thoroughly reorganized overall, with an eye on taking the reader beyond concepts to analysis and forecasting, that the Weather Analysis and Forecasting Handbook is for all intents and purposes a new book, not just an updated edition. And, I might add–and I say this rather grudgingly, having cut my teeth on the old handbook–this new volume is a more comprehensive and helpful resource than its venerable predecessor. There is just a lot more to this book, and it’s all presented in a well-thought-out fashion.

Main Content

One significant change in the Weather Analysis and Forecasting Handbook is the organization of its content. As does the previous book, this one begins by introducing foundational physical concepts such as mass, force, pressure, temperature, the Coriolis force, geostrophic wind, vorticity, and so forth.

The second chapter on observation also appears largely familiar, though it keeps abreast of current practices. However, the previous treatment of clouds is only lightly addressed because the subject is given an entire section of its own in the book’s appendices.

Beginning with chapter three, the changes become pronounced. Here is a very abbreviated overview of the book’s structure from this point:

Chapter three: Thermodynamics–Deals with instability and familiarizes the reader with atmospheric soundings. Here is where you’ll learn how to read and interpret that essential forecasting tool, the skew-T/log-P diagram.

Chapter four: Upper Air Analysis–Taking a top-down approach to forecasting, this chapter introduces constant pressure charts, long waves and short waves, divergence and convergence, jets and jet streaks, and other atmospheric processes and influences from 100 mb down to 925 mb.

Notably missing is a structured introduction to charts for specific pressure levels, such as the 500 mb height map. That discussion has been shifted to the appendices. Instead, chapter three focuses on the various factors that the maps depict, and the book makes such liberal use of the different maps by way of illustration that the reader gains familiarity with them through osmosis. My guess is, Tim believes that by helping readers understand upper-air dynamics and processes, the significance and use of the various maps will become apparent through real-world examples.

Chapter five: Surface Analysis–Learn how to read a surface chart, get a basic grasp of air masses, and discover the importance of various boundaries, from cold and warm fronts to drylines and outflow boundaries.

Chapter six: Weather Systems–This chapter groups together concepts from several chapters in the old forecasting handbook. The presentation is logical and fresh. Subjects covered include all-important baroclinic lows and highs, barotropic systems, arctic air outbreaks, and winter weather systems.

Chapters seven and eight deal, respectively, with satellite and radar. Suffice it to say that they are required reading. Since both remote-sensing tools are visual in nature, plenty of pictures are provided to illustrate patterns, systems, outflow boundaries, velocity aliasing, severe weather signatures, and so on.

I’m a bit surprised to see not a single screen grab of a velocity couplet, either in the radar chapter or in the ensuing chapter nine on convective weather. However, velocity products rely highly on a full-color format and don’t lend themselves easily to this book’s black-and-white images. Tim points this out later in figure 9-6, where he writes, “Typical NEXRAD color schemes do not reproduce well in monochrome books.”

Importantly, the chapter on radar discusses the new dual-polarization technology that is being implemented nationwide at the time of this review. Dual-pole is a huge development in the NEXRAD system, probably the biggest stride forward since the deployment of NEXRAD itself.

Chapter nine: Convective Weather–For aspiring storm chasers, this chapter will likely be the Holy Grail of the book. Besides dealing with the ins and outs of thunderstorms, from single-cells to supercells to mesoscale convective systems, this chapter discusses storm-relative winds and introduces another indispensable forecasting tool, the hodograph. Chapter nine moves on to talk about tropical systems including hurricanes.

Chapter ten: Prognosis–This last chapter in the main body of the book deals with the actual process of forecasting. Readers will at this point have recognized that Tim is a strong advocate for understanding not merely how the atmosphere is likely to behave, and where, and when, but also why. Here he discusses the four-part forecasting process. He emphasizes the importance of a hands-on approach to analysis while at the same time recognizing the key role of numerical models, the application, strengths, and weaknesses of which he discusses at length. The chapter concludes with a brief overview of ENSO and teleconnection patterns.

The entire book is amply illustrated. Barely a page exists that doesn’t include some kind of black-and-white chart, map, or photograph. These visual supplements are clear and immensely helpful, to the extent of being integral to understanding much of the written content.

To round things out, the book is peppered with sidebar commentary ranging from the informative, to the philosophical, to the historical, to the humorous. For instance, on page 31 I find a table of NATO color codes; page 57 furnishes a thumbnail discussion of long waves; a lengthy entry on page 120 describes five different empirical forecast techniques; and on page 166, there’s a wry commentary on how to tell whether a tornado is forming using the “thumb tab” approach of the Field Guide to North American Weather.

Appendices

This section is an informational gold mine. Strangely, it’s not even mentioned in the table of contents, so I’m going to give you the breakdown here:

Appendix one: Forecaster’s Guide to Cloud Types–Photos and descriptions of major cloud types, including brief discussions of each one’s significance from a forecasting standpoint.

Appendix two: Surface Station Plots–What all those numbers and symbols mean.

Appendix three: Surface Chart Analysis Procedures–Brief guidelines for doing surface analyses.

Appendix four: Upper Air Station Plots–Similar to the second appendix, except applied to upper air plots.

Appendix five: Upper Air Chart Analysis Procedures–This is about as close to an overview of specific pressure maps as this book provides, which it does from an analysis perspective. This appendix divides into three short sections on upper-, middle-, and lower-tropospheric charts. Between them, they provide insights on the significance, use, and analysis of upper-air maps from 100 millibars all the way down to 925 millibars.

Appendix six: An Isoplething Tutorial–Veteran forecasters invariably are strong advocates of hand analysis, and Tim is a prime example This appendix shows you how to get started at creating your own hand-analyzed weather maps.

Appendix seven: Conversions and Symbols.

Appendix eight: Instability Index Summaries–Brief discussions of the more commonly used forecasting indices such as CAPE, CINH, lifted indices, the energy-helicity index, and the SWEAT index. A couple of these tools–BRN shear and storm-relative helicity–aren’t in themselves related to instability; however they’re so widely used in severe weather forecasting that they require discussion, particularly since they’re factored into such true instability indices as the EHI, STP, and Bulk Richardson Number.

Appendix nine: Types of Thermodynamic Diagrams–Brief discussions and graphic examples of the skew-T/log-P, emagram, Stuve, pastagram, aerogram, and tephigram.

Appendix ten: Blank Diagrams–Reproducible blank skew-T and hodograph.

Appendix eleven: Observation Format Overview–For the incredibly geekish, a quick reference guide to the most commonly used weather-reporting formats: METAR, SYNOP, and TEMP (radiosonde code).

Additional appendix materials without assigned section numbers include the following: suggested reading, software, educational websites, government weather agency websites, and top-ten weather myths.

Three Recommendations


Let me preface my following few critiques by saying that this is a fantastic book. The author is both a veteran storm chaser and an educator, and that combination has inspired him to create a practical resource that is both accessible to lay-persons and helpful to operational forecasters. Storm chasers and anyone who wants to develop skill at weather forecasting would do well to put it in their library.

This said, I have three comments that Tim may wish to consider at some point:

• I liked the old handbook’s quick, specific introductions to the 200/250/300 mb, 500 mb, 700 mb, 850 mb, and surface charts. The overviews of those charts gave me–at a time when I was a complete novice and needed weather knowledge delivered to me in brick form–an instant, systematized reference to the constant-pressure maps that are such essential tools of the trade.

Granted, entire books have been written about weather maps, including Tim’s own Green Book, the Weather Map Handbook. The new Weather Analysis and Forecasting Handbook is obviously not intended to fill such a role. But perhaps in the appendix section, the fifth appendix could be fleshed out a bit by providing a top-down sampling of CONUS maps for a single date/time. That way those unfamiliar with upper atmospheric maps could see how, say, March 13, 2011, at 1200 UTC mapped out at 300 mbs, 500 mbs, 700 mbs, 850 mbs, 925 mbs, and on the surface.

• Granted the limitations of trying to translate something as color-dependent as radar velocity products into a gray-scale format, there may nevertheless be a benefit to making the attempt. I say this because the ability to recognize storm-relative velocity couplets is so critical in storm chasing. While the illustrations on page 145 (figs. 8-2a–f) do a good job of conveying the general idea, there’s nothing like real-life examples. Perhaps such examples could be included in the future, whether directly in the book or possibly as a link to a page featuring radar screen captures on Tim’s Weather Graphics website.

• A quick, easy-reference glossary of essential terms would be a welcome addition.

With these three suggestions on the table for Tim to consider in his next edition, I unhesitatingly recommend this book. It’s superb, a labor of love by one of the gurus of operational forecasting who clearly cares a great deal about helping others learn the ropes.

Some months back, I reviewed Tim’s other recent publication, Severe Storm Forecasting. It’s another excellent resource for storm chasers in particular, covering some of the same ground as this book and expanding considerably on the subject covered in chapter nine, “Convective Weather.” Good as that book is, though, Weather Analysis and Forecasting provides the more complete, well-rounded picture. Be forewarned: it’s not a book you will read and absorb in one sitting. It is chewy material that will require you to approach it analytically and patiently. This is a resource you will pull off the shelf again and again, whether to re-engage with material you’re still trying to grasp or to refresh yourself on concepts you’re already familiar with.

Purchasing Information

  • Weather Forecasting and Analysis by Tim Vasquez, 260 pages.
  • $29.95 plus shipping, available from Weather Graphics.

NOTE: This is a non-paid review. I’ve written it as a service to my readers and to Tim because, having read the book, I’m convinced of its value for storm chasers and severe weather buffs.
Book Review: Severe Storm Forecasting by Tim Vasquez

Beginning with his Weather Forecasting Handbook, which I purchased years ago at a College of DuPage severe weather conference, I’ve collected one-by-one nearly all of Tim Vasquez’s books on storm chasing and weather. The only exception is Tim’s most recent, 2011 publication, the Weather Forecasting and Analysis Handbook, and that’s next on my list.

The owner of Weather Graphics and the well-known storm chasing forum, Stormtrack, Tim is a widely acknowledged guru of storm chasing and operational forecasting, particularly in the severe weather arena. The man possesses more convective knowledge in his left pinkie than most of us do in our entire bodies, and in this fairly recent publication, he organizes information that is most relevant to chasers and severe weather junkies.

In Tim’s words, “Severe Storm Forecasting was a project started in 2007 to serve as the perfect companion for intermediate forecasters and a refresher for experienced forecasters. It maps the current state of severe thunderstorm forecasting from an operational framework rather than a research or academic perspective. Equations, physics, and lengthy citations have been kept to a bare minimum.” (From the preface.)

In other words, the book is intended to provide up-to-date, practical information that storm chasers can readily apply in forecasting and in the field. Since its release in 2010, I’ve been wanting to get my hands on this book. A while ago, I finally shelled out my $29.95 and purchased a copy, and I’ve spent the last several weeks chewing on it. It’s nutritious fare: thoughtfully organized, as current as is possible in a field shaped by rapid technological advances, and accessible to anyone who wants to apply him- or herself to developing severe weather forecasting skills.

Severe Storm Forecasting is divided into 10 sections as follows:

  • The Forecast Process
  • The Thunderstorm
  • Mesoscale Convective Systems
  • Tornadoes
  • Hail
  • Lightning
  • Stability & Shear
  • Radar
  • Satellite
  • Diagnosis
  • .
    An appendix contains additional information on the WSR-88D radar and the more commonly used diagnostic tools in severe weather forecasting, and also supplies blank, reproducible hodograph and skew-T/log-P charts.

    While the topics covered will be familiar to chasers who do their own forecasting, I’ve found plenty to broaden my scope, ranging from brand-new insights to discussions on topics with which I was only vaguely acquainted. For example, the section on QLCS tornadoes is the first time I’ve seen the subject given more than a casual nod. Here in Michigan, linear systems are far more common than isolated supercells, so it’s nice to encounter a book that spends a little time looking at their role as occasional tornado breeders.

    A strong asset of Severe Storm Forecasting is the way it aggregates the broad array of elements that are relevant to severe weather and then expands on them in one tidy package. Don’t get me wrong: this isn’t one-stop shopping. One book simply can’t cover everything in depth; pick any chapter and you can make a further study of its subject. But this book does much more than skim the surface. It is by no means a mere primer; it is a text that will equip you with a broad and substantial grasp of severe weather forecasting, and you shouldn’t conceive of it as a one-time read that you move through linearly and then “finish.” There’s too much content for a reader to absorb all in one pass, and much of it needs to be connected with field experience in order for it to gel. So look at Severe Storm Forecasting as a reference that you will process bit by bit. Once you’ve accomplished your initial read, you will return to it again and again.

    In the style of his other books, Tim has made ample use of sidebars to provide interesting asides that range from the historical to the technical. Just riffling through the pages, I find, for example, a call-out on page 75 that consists of material written in 1888 by Gustavus Hinrichs that sheds light on the origin of the word “derecho”; then a few pages later, on page 80, I read a smaller sidebar that discusses the term “swirl ratio”; and still further along, on page 95, I come across a fairly extensive personal communication from Paul Markowski on the contributing factors in warm versus cold RFDs.

    Three recommendations for improvement:

    1. 1. I’m surprised that a glossary was not included in a work of this nature. It is the one area in which I consider this book to be lacking, and I hope Tim will address the matter in his next edition.
    2. 2. An online supplement would add value. This could feature graphic, possibly interactive, examples of such topics as lifting and modifying forecast soundings, radar interpretation, and so forth. The supplement would be accessible only to purchasers using a code included in the back of the book. It could be used with other of Tim’s books as well, so one supplement could serve multiple purposes.
    3. 3. I have the sense that the editing was grassroots. The result is quite good, but speaking as someone with a background in publishing, I think the book could benefit from further proofreading or perhaps a light edit.

    With these things said, Severe Storm Forecasting is an eminently useful and well-done resource that belongs in a storm chaser’s library. If you’re a new chaser, I would recommend that you start with Storm Chasing Handbook, also by Tim; then purchase this book to expand your knowledge. Those with a bit more experience can jump right in. Regardless of your level of expertise, get this book. At some point, you’re either going to be glad you own it or else wish that you did.

    Purchasing Information

    • Severe Storm Forecasting by Tim Vasquez, 262 pages.
    • $29.95 plus shipping, available from Weather Graphics.

    NOTE: This is a non-paid, unsolicited review. I’ve written it as a service to my readers because I personally appreciate Tim’s book and feel that it provides a valuable and well-organized resource for storm chasers and severe weather buffs.
    So You Want to Be a Storm Chaser

    The long months are here for storm chasers. Winter, the season of convective inactivity. The time some of us love but most of us simply endure. Three months–four, really–lie between now and our favorite time of year when the spring storm season begins to ramp up.

    These are not idle months, though, or at least, they shouldn’t be. Now is the time for chasers to be cracking the books, reading papers, doing what they can to hone their forecasting skills. One great tool for achieving that objective has been the chase cases on Stormtrack.

    For those not familiar with them, the chase cases are a user-based initiative in which, for a given case, a forum member volunteers to supply suites of data commonly used by chasers to pinpoint their targets. The data is typically gleaned from NOAA archives of actual weather events, with the first batch of maps, soundings, radar, satellite images, and SPC text products usually time-stamped 00Z on the night before the event. Chasers consult the data and determine their initial staging areas, then adjust their positions as subsequent forecast suites are released over time. A typical chase case can take three days or more to complete, depending on how busy the person supplying the data is.

    At the end of it all, the players get to check their positions with the final radar images and storm reports and determine how they fared. Since these virtual scenarios are based on actual severe weather events that include verified tornadoes, the value of the chase cases is obvious. Besides being just plain fun, they allow participants to compare notes with what others are noticing in the forecasting tools and how they’re interpreting that information. They really help a person sharpen the razor during the snowy season.

    Chase case number 5 ended last night. A northwest flow event, it was a tough nut to crack, and a lot of people busted, including me. At one point, six of us selected Woodward, Oklahoma, as a place to hang out under a boundary. It was a virtual chaser convergence, one of several that occurred on this case, and it got me to thinking. Forty-four people participated in case number 5–not many, given the vastness of the territory actually involved; yet many of us wound up clustering in the same places and wound up on the same storms. My question: What fraction of actual chasers out on a real chase day did we represent? In real life, given a major chase event, you can bet that the number of people pursuing storms would far outstrip forty-four.

    It’s no secret that the hordes are increasing rapidly every year. Thanks to media shows such as Discovery Channel’s highly popular Storm Chasers series, what used to be a pretty solitary activity practiced by a relative handful has spiraled into a circus out on the Great Plains. Today it seems like everybody under the age of 30 wants to be a storm chaser, or at least, they think they do.

    Far be it from me to separate between a host of yahoos who mistake opportunistic lunacy for the art and science of chasing storms, versus the far fewer individuals whose interest is rooted in something more trustworthy than reality TV. It’s your right to chase storms if you want to, and everybody has to start somewhere. Shoot, I’ve been chasing for coming up on 15 years now, and I still consider myself rather green. Number of years doesn’t automatically translate into expertise. Nevertheless, I’ve seen enough to have formed some opinions about where storm chasing seems to be headed as more and more new blood flocks to Tornado Alley. To those of you who, inspired by what you’ve seen on television, plan on heading to the Plains for the first time this coming spring, I have this to say:

    Don’t be an idiot.

    I mean it. I’m not saying don’t go. I’m saying, before you go, learn about what it is that you’re getting into. There’s more to it than you realize, and if your knowledge thus far comes from watching a TV series or a handful of YouTube videos, then honestly, you don’t know jack.

    Start with this thought: Storm chasing is not about getting as close as you can to a tornado. “Extreme chasing” is a fairly new phenomenon that has been glorified by the media to the point where it has, in impressionable minds, set a new and dangerous standard. But it’s not the historical norm. The reality is, most veteran chasers have generally maintained a safe distance from tornadoes. So banish any images of driving to within 100 feet of a tornado. Hello? It’s a freaking TORNADO. And you’re not Reed Timmer or Tim Samaras. Those guys have knowledge and experience you can’t even imagine, and what you’ve seen of them on TV has been just one highly condensed, scripted, edited, incomplete, and not altogether accurate part of a much bigger picture. Trying to shortcut what is in fact a pretty involved learning curve could easily get you killed or maimed for life.

    Getting close to tornadoes is just one style of chasing. I have friends who practice it; it’s a choice they make based on their level of experience and situational awareness, which I respect, and I’m not going to knock them for it. They know the risks. For that matter, I’ve been pretty close myself on a few occasions, not always by choice. Every storm is different. In general, though, keeping a good mile or more between you and a tornado isn’t wimpy, it’s smart.

    Enough about that. Here’s my next bit of advice: Respect others who are on the road, and respect locals whose lives can be impacted both by the weather and by your own actions. Chasing a storm doesn’t accord you some sort of elite status to which traffic laws don’t apply. Parking your car in the middle of a traffic lane in order to take pictures of a storm is selfish, inexcusable behavior; either find a damn turnoff or else keep moving until you locate a place where you can pull over onto the shoulder. And driving 30 miles an hour over the speed limit endangers not only you, but others as well, particularly in a rainy storm environment where hydroplaning is a real danger. Last May in South Dakota a bunch of chasers, including me, had to deal with a very pissed-off sheriff whose attitude toward us had been provoked several hours prior by a chaser who blasted past him at 90 miles an hour. The sheriff was preoccupied at the time; otherwise he’d have busted the guy. As it stood, one thoughtless driver gave that LEO a bad impression of chasers in general, and he took his anger out on us. So remember, you don’t own the road. And no, being a rugged, individualistic American citizen doesn’t give you the right to conduct yourself in ways that negatively affect other people.

    I could probably have lumped both of my preceding points together by saying, educate yourself and use common sense. First and foremost, learn about storm structure and morphology. Discard any high-octane media images you may have of storm chasing and instead find out what it takes to chase safely and successfully. I highly recommend West Texas storm chaser Jason Boggs’ educational resource site–it’s a gold mine of information. So are severe weather forecasting guru Tim Vasquez’s books, available through his business, Weather Graphics. If you can only afford one book, get The Storm Chasing Handbook. It’s a great introduction to the nuts and bolts of chasing storms.

    Storm chasing is an incredible avocation with rewards that extend beyond the beauty and drama of the atmosphere to other dimensions, aesthetic, intellectual, interpersonal, and spiritual. But by its very nature, chasing storms is also a potentially dangerous activity. If you’re going to take it up, the smartest way to go about it is to exercise humility and restraint, and to make learning your priority rather than an adrenaline rush. Pursue that first objective and the second will come in due time.

    Be safe. Be smart. Be courteous. The Plains have gotten smaller and more crowded in recent years. How you conduct yourself on them, and the attitude you display, makes a difference for everyone.

    RAOB and Other Weather Widgets

    Some storm chasers pride themselves in being minimalists who have a knack for intercepting tornadoes without much in the way of gadgetry. Others are techies whose vehicles are tricked out with mobile weather stations and light bars. It’s all part of the culture of storm chasing, but the bottom line remains getting to the storms.

    To my surprise, while I draw the line at gaudy externals, I’ve discovered that I lean toward the techie side. For me, storm chasing is a lot like fishing. Once you’ve bought your first rod and reel and gotten yourself a tackle box, you find that there’s no such thing as having enough lures, widgets, and whizbangs. You can take the parallels as deep as you want to. Radar software is your fish finder. F5 Data, Digital Atmosphere, and all the gazillion free, online weather maps from NOAA, UCAR, COD, TwisterData, and other sources are your topos. And so it goes.

    A couple years ago I spent $300 on a Kestrel 4500 weather meter. It’s a compact little unit that I wear on a lanyard when I’m chasing. It weighs maybe twice as much as a bluebird feather, but it will give me temperature, dewpoint, wind speed, headwinds, crosswinds, wind direction, relative humidity, wet bulb temperature, barometric pressure, heat index, wind chill, altitude, and more, and will record trends of all of the above.

    I use it mostly to measure the dewpoint and temperature.

    Could I have gotten a different Kestrel model that would give me that same basic information for a third of the cost, minus all the other features that I rarely or never use? Heck yes. Nevertheless, I need to have the rest of that data handy. Why? Never mind. I just do, okay? I need it for the same reason that an elderly, retired CEO needs a Ferrari in order to drive 55 miles an hour for thirty miles in the passing lane of an interstate highway. I just never know when I might need the extra informational muscle–when, for instance, knowing the speed of crosswinds might become crucial for pinpointing storm initiation.

    If I lived on the Great Plains, with Tornado Alley as my backyard, I might feel differently. But here in Michigan, I can’t afford to head out after every slight-risk day in Oklahoma. Selectivity is important. I guess that’s my rationale for my preoccupation with weather forecasting tools, along with a certain vicarious impulse that wants to at least be involved with the weather three states away even when I can’t chase it. Maybe I can’t always learn directly from the environment, but I can sharpen my skills in other ways.

    Does having all this stuff make me a better storm chaser? No, of course not. Knowledge and experience are what make a good storm chaser, and no amount of technology can replace them. Put a $300 Loomis rod in the hands of a novice fisherman and chances are he’ll still come home empty-handed; put a cane pole in the hands of a bass master and he’ll return with a stringer full of fish. On the other hand, there’s something to be said for that same Loomis rod in the hands of a pro, and it’s not going to damage a beginner, even if he’s not capable of understanding and harnessing its full potential. Moreover, somewhere along the learning curve between rookie and veteran, the powers of the Loomis begin to become apparent and increasingly useful.

    Now, I said all of that so I can brag to you about my latest addition to my forecasting tackle box: RAOB (RAwinsonde OBservation program). This neat little piece of software is to atmospheric soundings what LASIK is to eye glasses. The only thing I’ve seen that approaches it is the venerable BUFKIT, and in fact, the basic RAOB program is able to process BUFKIT data. But I find BUFKIT difficult to use to the point of impracticality, while RAOB is much easier in application, and, once you start adding on its various modules, it offers so much more.

    RAOB is the world’s most powerful and innovative sounding software. Automatically decodes data from 35 different formats and plots data on 10 interactive displays including skew-Ts, hodographs, & cross-sections. Produces displays of over 100 atmospheric parameters including icing, turbulence, wind shear, clouds, inversions and much more. Its modular design permits tailored functionality to customers from 60 countries. Vista compatible.

    –From the RAOB home page

    The basic RAOB software arrived in my box a couple weeks ago courtesy of Weather Graphics. It cost me $99.95 and included everything needed to customize a graphic display of sounding data from all over the world.

    I quickly realized, though, that in order to get the kind of information I want for storm chasing, I would also need to purchase the analytic module. Another $50 bought me the file, sent via email directly from RAOB. I downloaded it last night, and I have to say, I am absolutely thrilled with the information that is now at my disposal.

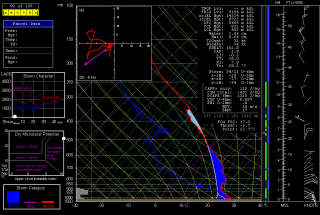
    Here is an example of the RAOB display, including skew-T/log-P diagram with lifted parcel, cloud layers, hodograph, and tables containing ancillary information. Click on the image to enlarge it. The display shown is the severe weather mode, with the graphs on the left depicting storm character, dry microburst potential, and storm category. (UPDATE: Also see the more recent example at the end of this article.)

    The sounding shown is the October 13, 2009, 12Z for Miami, Florida–a place that’s not exactly the Zion of storm chasing, but it will do for an example. Note that the negative area–that is, the CIN–is shaded in dark blue. The light blue shading depicts the region most conducive to hail formation. Both are among the many available functions of the analytic module.

    The black background was my choice. RAOB is hugely customizable, and its impressive suite of modules lets you tailor-make a sounding program that will fit your needs beautifully. Storm chasers will want to start with the basic and analytic modules. With that setup, your $150 gets you a wealth of sounding data on an easy-to-use graphic interface. It’s probably all you’ll ever need and more–though if you’re like me, at some point you’ll no doubt want to add on the interactive and hodo module.

    And the special data decoders module.

    Oh yeah, and the turbulence and mountain wave module. Gotta have that one.

    Why?

    Never mind. You just do, okay?

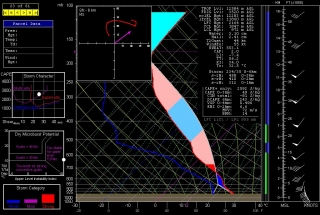
    ADDENDUM: With a couple storm seasons gone by since I wrote the above review, I thought I’d update it with this more timely image. If you’re a storm chaser, you’ll probably find that what the atmosphere looked like in May in Enid, Oklahoma, is more relevant to your interest than what it looked like in Miami in October.