Some storm chasers pride themselves in being minimalists who have a knack for intercepting tornadoes without much in the way of gadgetry. Others are techies whose vehicles are tricked out with mobile weather stations and light bars. It’s all part of the culture of storm chasing, but the bottom line remains getting to the storms.
To my surprise, while I draw the line at gaudy externals, I’ve discovered that I lean toward the techie side. For me, storm chasing is a lot like fishing. Once you’ve bought your first rod and reel and gotten yourself a tackle box, you find that there’s no such thing as having enough lures, widgets, and whizbangs. You can take the parallels as deep as you want to. Radar software is your fish finder. F5 Data, Digital Atmosphere, and all the gazillion free, online weather maps from NOAA, UCAR, COD, TwisterData, and other sources are your topos. And so it goes.
A couple years ago I spent $300 on a Kestrel 4500 weather meter. It’s a compact little unit that I wear on a lanyard when I’m chasing. It weighs maybe twice as much as a bluebird feather, but it will give me temperature, dewpoint, wind speed, headwinds, crosswinds, wind direction, relative humidity, wet bulb temperature, barometric pressure, heat index, wind chill, altitude, and more, and will record trends of all of the above.
I use it mostly to measure the dewpoint and temperature.
Could I have gotten a different Kestrel model that would give me that same basic information for a third of the cost, minus all the other features that I rarely or never use? Heck yes. Nevertheless, I need to have the rest of that data handy. Why? Never mind. I just do, okay? I need it for the same reason that an elderly, retired CEO needs a Ferrari in order to drive 55 miles an hour for thirty miles in the passing lane of an interstate highway. I just never know when I might need the extra informational muscle–when, for instance, knowing the speed of crosswinds might become crucial for pinpointing storm initiation.
If I lived on the Great Plains, with Tornado Alley as my backyard, I might feel differently. But here in Michigan, I can’t afford to head out after every slight-risk day in Oklahoma. Selectivity is important. I guess that’s my rationale for my preoccupation with weather forecasting tools, along with a certain vicarious impulse that wants to at least be involved with the weather three states away even when I can’t chase it. Maybe I can’t always learn directly from the environment, but I can sharpen my skills in other ways.
Does having all this stuff make me a better storm chaser? No, of course not. Knowledge and experience are what make a good storm chaser, and no amount of technology can replace them. Put a $300 Loomis rod in the hands of a novice fisherman and chances are he’ll still come home empty-handed; put a cane pole in the hands of a bass master and he’ll return with a stringer full of fish. On the other hand, there’s something to be said for that same Loomis rod in the hands of a pro, and it’s not going to damage a beginner, even if he’s not capable of understanding and harnessing its full potential. Moreover, somewhere along the learning curve between rookie and veteran, the powers of the Loomis begin to become apparent and increasingly useful.
Now, I said all of that so I can brag to you about my latest addition to my forecasting tackle box: RAOB (RAwinsonde OBservation program). This neat little piece of software is to atmospheric soundings what LASIK is to eye glasses. The only thing I’ve seen that approaches it is the venerable BUFKIT, and in fact, the basic RAOB program is able to process BUFKIT data. But I find BUFKIT difficult to use to the point of impracticality, while RAOB is much easier in application, and, once you start adding on its various modules, it offers so much more.
RAOB is the world’s most powerful and innovative sounding software. Automatically decodes data from 35 different formats and plots data on 10 interactive displays including skew-Ts, hodographs, & cross-sections. Produces displays of over 100 atmospheric parameters including icing, turbulence, wind shear, clouds, inversions and much more. Its modular design permits tailored functionality to customers from 60 countries. Vista compatible.
–From the RAOB home page
The basic RAOB software arrived in my box a couple weeks ago courtesy of Weather Graphics. It cost me $99.95 and included everything needed to customize a graphic display of sounding data from all over the world.
I quickly realized, though, that in order to get the kind of information I want for storm chasing, I would also need to purchase the analytic module. Another $50 bought me the file, sent via email directly from RAOB. I downloaded it last night, and I have to say, I am absolutely thrilled with the information that is now at my disposal.
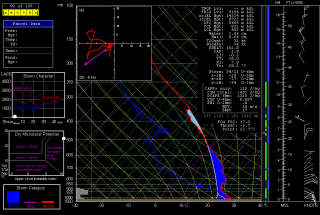
Here is an example of the RAOB display, including skew-T/log-P diagram with lifted parcel, cloud layers, hodograph, and tables containing ancillary information. Click on the image to enlarge it. The display shown is the severe weather mode, with the graphs on the left depicting storm character, dry microburst potential, and storm category. (UPDATE: Also see the more recent example at the end of this article.)
The sounding shown is the October 13, 2009, 12Z for Miami, Florida–a place that’s not exactly the Zion of storm chasing, but it will do for an example. Note that the negative area–that is, the CIN–is shaded in dark blue. The light blue shading depicts the region most conducive to hail formation. Both are among the many available functions of the analytic module.
The black background was my choice. RAOB is hugely customizable, and its impressive suite of modules lets you tailor-make a sounding program that will fit your needs beautifully. Storm chasers will want to start with the basic and analytic modules. With that setup, your $150 gets you a wealth of sounding data on an easy-to-use graphic interface. It’s probably all you’ll ever need and more–though if you’re like me, at some point you’ll no doubt want to add on the interactive and hodo module.
And the special data decoders module.
Oh yeah, and the turbulence and mountain wave module. Gotta have that one.
Why?
Never mind. You just do, okay?
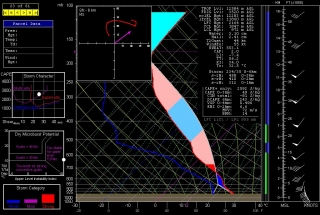
ADDENDUM: With a couple storm seasons gone by since I wrote the above review, I thought I’d update it with this more timely image. If you’re a storm chaser, you’ll probably find that what the atmosphere looked like in May in Enid, Oklahoma, is more relevant to your interest than what it looked like in Miami in October.


