Are the Great Plains About to Open for Business?

ECMF-GFS H5 fcst 0408013Last year’s abnormally balmy March opened for storm chasers with a lion-like roar on the 2nd with a deadly outbreak of tornadoes along the Ohio River southward. But from then on, with the exception of April 13 and 14, the season dwindled into a pathetic, lamb-like bleat.

This March has been the polar opposite, and I do mean polar. Many chasers have been champing at the bit due to a wintry pattern that has simply refused to let go. But that may finally be about to change, and April may be the month when this year’s chase season starts to howl. For the last several days, I’ve been eyeballing a large trough on the GFS that wants to invade the Great Plains around April 8, shuttling in Gulf moisture and also suggesting the possibility of warm-front action farther east on the 9th.

GFS H5 fcst 00z 040913
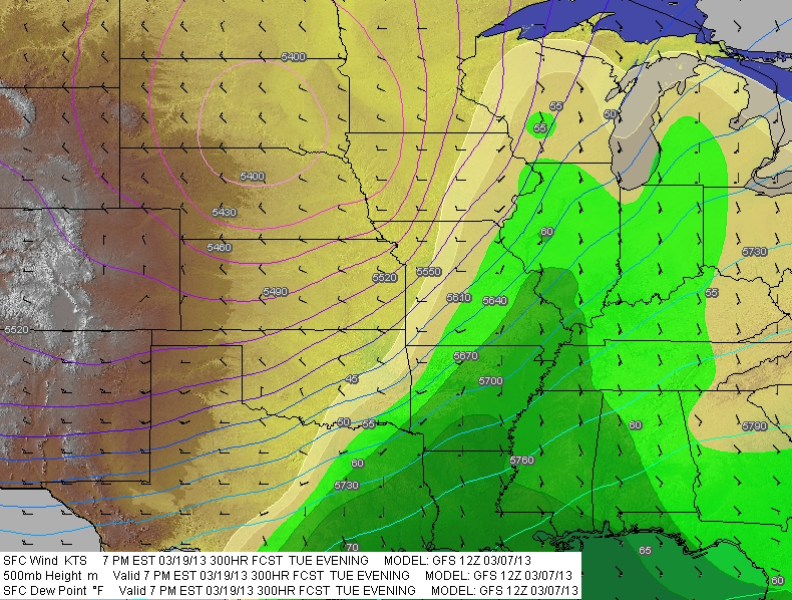
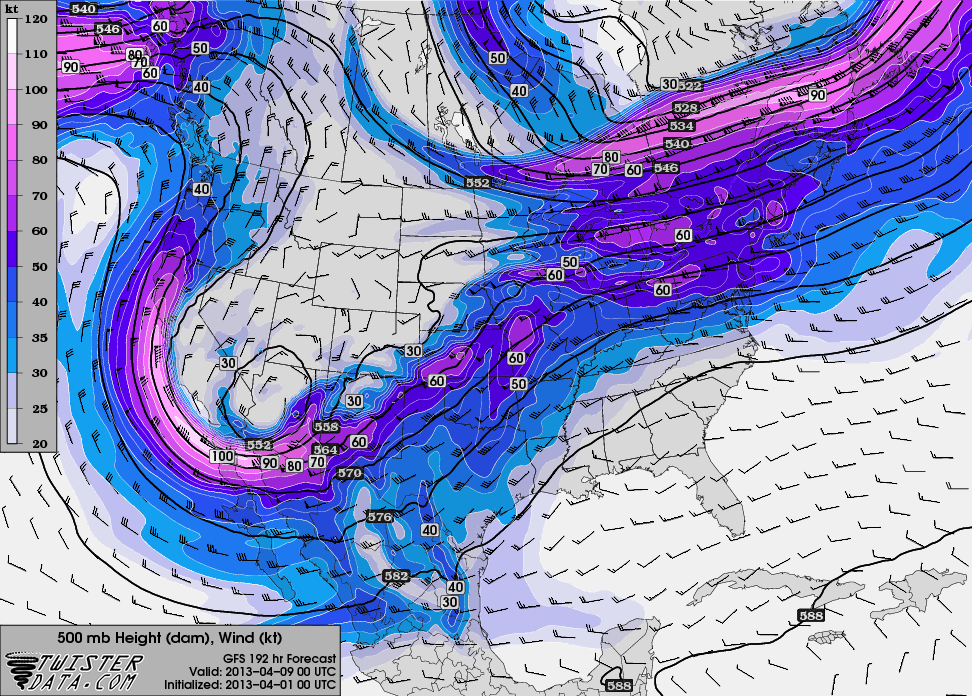
The ECMWF broadly agrees. The first map (click to enlarge), initialized today at 00Z, compares the 168 hour forecasts for GFS and Euro heights for Sunday evening, April 7 (00Z April 8). The second map, from TwisterData, depicts the GFS 24 hours later at 7 p.m. CST.

Maybe not a poster child for negative tilting (though the 6Z run changes that), but it could signal the breaking of the Champagne bottle against the hull of chase season 2013. The details will fill themselves in as the forecast hour narrows down. Right now, this is a hopeful sign for storm chasers. Winter may still have a gasp or two left, but we’ve made it through, and change is on the way.

Prior to that, the models point to a shortwave moving through the upper Midwest next weekend. Will it have sufficient moisture and instability to work with near the warm front? Good question; we’ll find out, assuming subsequent model runs don’t wash it out. So far it has shown up consistently. For those of us who live northeast of Tornado Alley, it’s worth keeping an eye on.


The Foibles of Long-Range Forecast Models

Tues_March_19_GFS300hrsSometimes a picture really is worth a whole lot of words. In this case, two tell the story more eloquently than I can.

In the image to your left, the 12Z run of the  GFS depicts 500 mb height contours, surface moisture, and surface winds at 300 hours out, or twelve days before the forecast date.

The second image, taken just a little while ago, shows the same information for the same system, only now we’re down to just 66 hours from forecast time. Note that the forecast date has moved up a day to Monday; by Tuesday, the whole system has moved off to the east and out to sea. Bye-bye moisture and instability.

Mon_March_18_GFS66hrsWhat happened? The GFS happened, that’s what.

I realize that for many of my storm chasing readers, maybe most of you, I’m preaching to the choir, but some may wish to take note of the following:

Long-range forecast models are notoriously undependable and prone to change.

If you’ve never heard the colloquialism wish-casting, now’s the time to add it to your storm chasing lexicon. The further out you go beyond three days from an event, the more that attempting to forecast a chaseable setup amounts to just a hope and a prayer. Bad data and changing data amplify progressively in the numerical models, to the point where what you see at 240 hours out is subject to anything from mild to wild fluctuation and revision as the forecast hour draws closer and new data gets processed. By the time the NAM and SREF lean in, and finally the RAP and HRRR, what you see may resemble nothing like the deep, negatively tilted trough and gorgeous moisture plume that first captured your attention. The shape, the timing, wind speed and direction at different heights, quality of moisture, instability–everything can change, and it will, possibly quite drastically.

Remember the gossip chain? Anna tells Peter, “Selena just bought a used Nissan from the same car dealer where Jaden bought his truck. It’s on 44th Street about a mile from the dump.” Peter passes the news on to Sam thus: “Selena just bought a car from the same dealer where Jaden got his truck next to the 44th Street dump.” Sam tells Chelsea, and Chelsea tells Adam, and so it goes, with the information getting nuanced a little more each time until it becomes outright twisted. Finally, word gets back to Selena: “Hey, Selena, what’s this I hear about you buying the dump over on 44th Street from some drug dealer?”

It can be kind of that way with long-range forecasts.

So why even bother watching the long-range models, particularly the famously untrustworthy GFS? There are two reasons. One is, the models can provide a heads-up to the possibility of a chaseworthy setup. At 192 hours out, don’t think of the models as forecasts–think of them as potential forecasts, something to keep an eye on. A given scenario could fall completely apart and often does. But it could also develop run-to-run consistency that agrees with the short-range models as they enter the picture, and ultimately lead to a decent chase.

For those of us who have to drive a long distance to Tornado Alley, such advance awareness is particularly valuable. If you live in Chickasha, Oklahoma, or Wichita, Kansas, you can roll out of bed in the morning, look at the satellite, surface obs, NAM, and RAP, and decide whether you’re going to chase in the afternoon. But if you live in Grand Rapids, Michigan, or Punxatawney, Pennsylvania, things aren’t that easy. When you’ve got to travel 800 to 1,000 miles or more to get to the action, burning time and fuel and perhaps vacation days, lead-time becomes important, and the more, the better.

The second reason for watching the long-range models is sheer obsessiveness. Call it desperation if you wish. It has been a long winter and storm chasers are itching to hit the road. Some of us just can’t help ourselves–we want to see some flicker of life, some sign of hope, some indication of the Gulf conveyor opening for business beneath a warming sun and dangerous dynamics. What’s the harm in that? Most of us know enough not to hang our hats on a 120-hour forecast, let alone one that’s two weeks out. But it doesn’t hurt to dream. After all, sometimes dreams come true.

Intercepting the March 2, 2012, Palmyra-Henryville-Marysville, Indiana, Tornado

Now, while my video from Friday’s chase is uploading to YouTube, is a good time for me to write my account of how things transpired down in southern Indiana.

The phrase “historic event” rarely describes something good when applied to severe weather. March 2 may qualify as a historic event. The current NOAA tally of tornado reports stands at 117; the final number, while likely smaller once storm surveys have been completed and multiple reports of identical storms have been consolidated, may still set Friday’s outbreak apart as the most prolific ever for the month of March. Whether or not that proves true, Friday was unquestionably a horrible tornado day that affected a lot of communities from southern Indiana and Ohio southward.

The Storm Prediction Center did an excellent job of keeping track of the developing system, highlighting a broad swath of the eastern CONUS for a light risk in the Day Three Convective Outlooks and upgrading the area on Day Two to a moderate risk. On Day One, the first high risk of 2012 was issued for a four-state region that took in southern Indiana and southwest Ohio, most of Kentucky, and north-central Tennessee–a bullseye in the middle of a larger moderate risk that cut slightly farther north and east and swept across much of Mississippi and Alabama as well as northwestern Georgia.

The SPC and NWS offices weren’t the only ones keeping vigilance. Storm chasers across the country were watching the unfolding scenario, among them being my good friend Bill Oosterbaan and me. Here are the February 29 00Z NAM model sounding and hodograph for March 2, forecast hour 21Z, at Louisville, Kentucky. (Click on the images to enlarge them.) With MLCAPE over 1,800 J/kg, 0-6 km bulk shear of 70 knots, and 1 km storm-relative helicity at 245 m2/s2, the right stuff seemed to be coming together. By the time the storms actually started firing, those figures were probably conservative, particularly the low-level helicity, which I recall being more in the order of 400 m2/s2 and up. Simply put, the region was going to offer a volatile combination of moderate instability overlaid by a >50-knot low-level jet, with a 100-plus-knot mid-level jet core ripping in.

I had my eyes set on southeastern Indiana. The problem with that area is, it’s lousy chase terrain along the Ohio River, and it doesn’t improve southward. If there was an ace-in-the-hole, it was Bill’s knowledge of the territory, gleaned from his many business trips to Louisville.

We hit the road at 7:15 that morning, stopping for half an hour in Elkhart so Bill could meet with a client and then continuing southward toward Louisville. Bill was of a mind to head into Kentucky, where the EHIs and CAPE were higher; I was inclined to stay farther north, closer to the jet max, the warm front, and, presumably, stronger helicity. But either choice seemed likely to furnish storms, and since Bill was driving, has good instincts, and knows and likes western Kentucky, I was okay with targeting the heart of the high risk rather than its northern edge.

But that plan changed as we drew near to Louisville. By then, storms were already firing, and one cell to our southwest began to take on a classic supercellular appearance. Bill was still for heading into Kentucky at that point, but after awhile, a second cell matured out ahead of the first one. We now had two beautiful, classic supercells to our southwest, both displaying strong rotation. It was a case of the old adage, “A bird in the hand is worth two in the bush”–except in this case, there were two birds, back to back. And I-64 would give us a clear shot at both of them.

So west we went, and into chase mode. At the Corydon exit, we caught SR 135 north, headed for an intercept with the first supercell. The two radar captures show the base reflectivity and SRV shortly after we began heading up the state road.

A few miles south of Palmyra, we got our first glimpse of a wall cloud maybe four miles distant. That’s all there was at that point, and the hilly, forested terrain afforded less-than-optimal viewing. Within a minute or two, we emerged into an open area just in time to see a funnel descend from the cloud. Tornado!

The sirens were sounding in Palmyra, providing an eldritch auditory backdrop to the ropy funnel writhing in the distance as we drove through town. The tornado went through various permutations before expanding into a condensation cone revolving like a great auger above the treeline. It was travelling fast–a good 60 miles an hour, at a guess. As we sped toward it, the condensation hosed its way fully to the ground and the tornado began to broaden. It crossed the road about a half-mile ahead of us, continuing to intensify into what appeared to be a violent-class tornado with auxiliary vortices wrapping around it helically.

Shortly after, Bill and I came upon the damage path. We pulled into a side road lined with snapped trees, amid which a house stood, somehow untouched except for a number of peeled shingles. The tornado loomed over the forest beyond, an immense, smoky white column wrapping around itself, rampaging northeastward toward its fateful encounters with Henryville and Marysville.

The time was just a few minutes before 3:00 eastern time. While I prepared and sent a report to Spotter Network, Bill turned around and headed back south. We had another storm to think about, and it was closing in rapidly. It wouldn’t do to get caught in its way.

Back in Palmyra, we headed west and soon came in sight of another wall cloud. This storm also reportedly went tornadic, but it never produced during the short time that we tracked with it. We lost it north of Palmyra; given the topography, the roads, and the storm speed, there was no question of chasing it.

From that point, we headed south across the river into Kentucky to try our hand at other storms, but we saw no more tornadoes, nor, for that matter, much in the way of any serious weather. Not that there weren’t plenty more tornado-warned storms; we just couldn’t intercept them, and after giving it our best shot, we turned around and headed for home.

Lest I forget: my worst moment of the chase came when I couldn’t locate my video of the tornado in my camera’s playback files. It seemed unfathomable that I could have horribly botched my chance to finally capture decent tornado footage with my first-ever hi-def camera. After being miserably sidelined during last year’s record-breaking tornado season, the thought that I had somehow failed to record this day’s incredible intercept just sickened me. Fortunately, there were no sharp objects readily available; and better yet, the following morning I discovered that I had simply failed to scroll up properly in the playback mode. All my video was there, and it was spectacular. Here it is:

My excitement over the video was offset by reports of just how much devastation this tornado caused eighteen miles northeast of where it crossed the road in front of Bill and me. Henryville, obliterated. Marysville, gone. Eleven lives lost in the course of that monster’s fifty-two-mile jaunt. And similar scenarios duplicated in other communities across the South and East. The death toll for the March 2 outbreak presently stands at around forty.

In the face of a mild winter and an early spring, Friday was the inauguration for what may be yet another very active severe weather season east of the Mississippi. We can only hope that there will be no repeats of last year’s wholesale horrors. May God be with those have lost loved ones and property in Friday’s tornadoes.

An Interview with RAOB Developer John Shewchuk

Two of the handier implements in a storm chaser’s forecasting toolkit are the skew-T/log-P and the hodograph. These two charts typically come bundled together, furnishing vertical slices of the upper air that show graphically how the atmosphere is behaving—or, in the case of forecast soundings, is projected to behave—from 100 millibars all the way down to the surface.

If you want to see at a glance how unstable the atmosphere is and how much convective inhibition suppresses that instability, look at a skew-T. If you want to know in what direction and how fast storms are likely to move and how much low-level helicity they’re likely to ingest, consult a hodograph. The skew-T and hodograph, along with a multitude of derived indices that often attend them, provide a wealth of vital information.

Soundings can be obtained from a variety of sources, many of them free. Among those sources, RAOB is in a league of its own. Its website homepage describes it as “the world’s most powerful and innovative sounding software. Automatically decodes data from 45 different formats and plots data on 12 interactive displays including skew-Ts, hodographs, & cross-sections. Produces displays of over 200 atmospheric parameters including icing, turbulence, wind shear, clouds, inversions and more.”

A couple years ago, I purchased the Basic module and several others—the Analytic, the Hodograph and Interactive, the Advanced Cross-Section, and the Special Data Decoders—and thus gained empirical familiarity with the powers of RAOB. It is an amazing program, all the moreso for its ease of use. Yet I have to confess that I’ve only scratched its surface. I simply don’t have the know-how to tap into its full capabilities. The more meteorologically and technically astute a user is, and the deeper one wants to dig into the atmosphere, the more RAOB will deliver.

In this interview, RAOB developer John Shewchuk talks about his brainchild. John presents his bio thus:

My life in three steps: (1) Born at West Point, New York—so I knew I wanted to be a military guy. (2) Started playing the accordion at age eight—because my parents told me to. (3) Got interested in weather during high school—because it fascinated me. Putting the three all together, I went to Penn State for my meteorology degree while playing the “Rain, Rain Polka” at parties for extra income, and I graduated with an ROTC commission in the Air Force. After twenty-two years in the USAF Weather Service, I retired as a lieutenant colonel.

I am now back in my hometown of Matamoras, Pennsylvania, in the house that my grandpa built. Here I operate the RAOB factory with loving assistance from my wife, Elaine.  Of course, that assistance remains loving as long as I also play music other than polkas, like maybe “Stormy Weather” or “Misty” and songs from the Four Seasons group.

That’s John in his own words. I will add one other thing: he is one of the most service-oriented persons you’re ever likely to encounter. While I forget what my first support issue involved, I haven’t forgotten John’s response. He was right there, responding quickly and helpfully, and he has continued to be “right there” ever since.

Be forwarned, the following is a lengthy interview. I’ve considered breaking it into two installments, but I don’t think it lends itself well to that approach. So I’m leaving it intact, trusting that storm chasers, meteorologists, and anyone interested in cutting-edge weather technology will find this post worth reading in its entirety.

Interview with RAOB Developer John Shewchuk

.
Question: RAOB is incredibly sophisticated weather software. I understand that it is the most powerful of its kind in the world—true? What is your background that equipped you to create it?

John: True in that no other program offers the same degree of functionality and capability in a very user-friendly interface. My twenty-two years in the USAF Weather Service and eight worldwide assignments were fundamental to my knowledge of meteorology. College academics were a good start, but the hands-on, daily routine of creating weather maps and issuing operational forecasts were invaluable to understanding how weather really works.

The majority of my severe weather experience comes from eleven years of multiple assignments at Offutt Air Force Base in Omaha, Nebraska. Other valuable experiences came from duties as a science officer and while stationed at the Typhoon Warning Center in Guam.

But knowledge of meteorology is only part of the story; computer programming is the other part. While at college, I also became fascinated with the power of computer code and spend many hours dabbling with Fortran IV. That interest remained mostly dormant while in the Air Force, as I only used automation as it related to daily duties. But when the personal computer hit the public market, I bought my first PC, the Tandy 1000.

Wow, what power! What a thrill to be able to channel electrons into intelligent processes through computer code. My life had changed dramatically, and my accordion became jealous. I taught myself Visual Basic (since it was similar to Fortran) and began to write small DOS programs. I soon upgraded to a VGA color monitor, a dot-matrix printer, a second floppy disk drive, and more memory. And then, after some deliberation—about two seconds—I went all the way. I broke open my piggy bank and got my first harddrive. Six hundred dollars for a whopping 20 Mb—what a deal! I had now attained nirvana.

I started to write small computer games for my kids and utilities for myself and others. I later began publishing computer and software articles for a PC magazine and won some programming contests. And just to remain in good standing with my accordion, I joined a local community polka band and performed at some fun Octoberfests at California’s Big Bear Lake and other local events. I just love those oompah bands!  I later appeared as the guest PJ (Polka Jockey, versus the more traditional DJ or Disk Jockey) for my wife’s surprise retirement party.  I used the fake beard and mustache to hide my identity since I wasn’t part of the oompah musicians union.

Q: What first inspired you to create RAOB, and when did you begin working on it? How long did it take before the first version was ready for release?

J: While programming games for the kids and utilities for others, I never considered meteorological applications. I instead used the time as a diversion from work—more like relaxation. During this time, I was aware that there were a very few, simple skew-T programs available, but only to large platform government and corporate entities.

But then toward the end of my Air Force career, I heard that one company was creating an advanced interactive weather display and skew-T system for military use for some very big bucks. So then I said, “Hmm, I think I can do a better job for much less.” That was twenty-four years ago.

I soon stopped programming kids’games and started the slow and systematic construction of a skew-T program. Remember, this was all off-duty time, during nights and weekends, and was still in the good old DOS days. My goal was never to market the program, but only to use it as my personal analysis tool, since after military retirement, I planned to use the program to help me with my intended weather consulting business.

In the end, that consulting business never amounted to much. However, soon after beginning the skew-T project, I met Richard Cale at a local American Meteorological Society monthly meeting. Richard (now deceased) had a very successful weather consulting business and helped me obtain my license as a Certified Consulting Meteorologist.

More importantly, for the previous ten years, Richard had been developing advanced upper-air applications on his hand-held, programmable Texas Instrument calculator (a TI-59) while tediously hand-plotting skew-T diagrams.  Within twenty-four hours we met again and began a wonderful collaboration on the skew-T project. In return for access to his analysis notes and algorithms, I gave him exclusive use of the developing skew-T program, now called RAOB.

Over the next several months, RAOB developed into a functional skew-T program that could accurately process and plot sounding data using a simple user format.  At Richard’s insistence, I added graphic interactive capabilities, which made RAOB a powerful data interrogation tool. These interactive capabilities, such as click-and-drag and other graphic editing features, made RAOB ideal for atmospheric research and forensic applications—perfect for a consulting meteorologist or anyone needing fast and accurate answers to “what if” questions.

Richard was delighted, as RAOB significantly improved his capabilities and productivity. And I was happy to now have a functioning skew-T program. However, it was of no use to me in my now-struggling weather consulting business, which mainly consisted of weather-related slip-and-fall and property damage cases. So, in order to pay the bills, I had to take a full-time salaried day job as a database manager. It was not a weather job, but it at least allowed me to stay current in the field of automation.

Just when I thought my weather career was nearing its end, Richard and some other friends suggested that I try selling RAOB, especially since Internet marketing and webmail were rapidly evolving at that time. In 1997, nearly ten years after the program’s inception, I sold the first RAOB (DOS) program. RAOB had transitioned from a hobby to a business.

After five more years, I converted RAOB from a DOS program to a Windows-based application. I am now retired from my day job and work full-time on the RAOB program—finally.

Q: Who are some of your customers, and what are some of the various, perhaps unique, ways in which they use RAOB?

J: RAOB customers are worldwide and are in sixty-four countries (that I know of). I am pleased to say that RAOB is used by the NTSB, NASA, EPA, over 110 universities and many high schools, over 450 TV weather stations, many NWS offices, several US and foreign military services, and other numerous interests from industry, commerce, and public safety.

Special applications include the monitoring of high-value properties such as airports, where RAOB automatically downloads new data, updates various diagram displays, and produces alert notifications of everything from low-level wind shear to fog threats. Competitive soaring pilots also like RAOB because it can identify the altitude, wavelength, and vertical displacement of mountain waves, which are critical during long-distance racing. Other clients use RAOB for detailed analyses of freezing levels, frontal zones, and inversions in the application of cloud seeding for hail suppression purposes. Due to its unique, high-resolution, interactive capabilities, RAOB is the perfect tool for educational and research purposes, both private and government. And storm chasers are always asking for new indices and parameters, which I add at every opportunity.

Q: Storm chasers have various options for obtaining free forecast soundings, two popular ones being TwisterData and Earl Barker. BufKit obviously offers an amazing array of features. What are some advantages of RAOB that set it apart, and that chasers might particularly value?

J: RAOB has five unique advantages over the above free sources of sounding data: (1) RAOB can automatically detect and analyze over forty-five different sounding data formats. New decoders are constantly being added to RAOB while the older ones are kept up to date. For those formats not yet automatically decoded, the user can manually input sounding data into RAOB’s two different data editors. With these flexible input options, RAOB can process any sounding data.

(2) RAOB allows the experienced user to graphically adjust, or edit, any sounding data point—temperature, dewpoint, and wind—and watch the resulting parameter listings and diagrams instantly update on the screen. This can be done on the sounding skew-T diagrams and hodographs.

There is also a special DALR (dry adiabatic lapse rate) function that can automatically adjust the lower atmosphere to simulate heating of the boundary layer, which is a critical parameter in severe weather analyses. These graphic adjustment capabilities give RAOB users a powerful “what if” tool.

(3) While many sources of gridded weather maps and associated forecast soundings are available via the Internet, they lag the availability of the original soundings by a few hours depending on forecast module and source. RAOB, on the other hand, can immediately process the observed sounding file (as available from the Internet or otherwise) and provide a fast, first look at the atmosphere. If RAOB has access to the Internet, the new soundings can be automatically downloaded and processed, depending on data source availability. Automatic, configurable alerts (visual and audible) are also available.

(4) Since most of us live and work between those widely spaced rawinsonde observing sites, RAOB fills the gap with its interpolation function, which can create a complete sounding between any two or any group of soundings. Then, once you have the sounding you need, RAOB can turn that profile into a short-term forecast. If upwind soundings are available, RAOB can automatically use those upwind soundings for time/height advection during forecast creation. If there are no upwind soundings available, RAOB can still create a forecast sounding using classic thermal wind theory logic. RAOB can forecast any sounding. No other skew-T program can perform these functions.

(5) RAOB’s unique severe weather display options make it ideal for those needing fast, accurate storm potential information. Diagrams and text displays can be individually configured to meet user needs. More importantly, individual index and parameter thresholds can be configured to local and seasonal conditions. For example, CAPE thresholds can be adjusted for low, moderate, and severe categories. Theses categories can then be displayed via user-defined colors. The Severe Weather Parameter Table contains forty-eight severe weather parameters that can be configured, which are then automatically consolidated into a simple graphic display for fast analyses.  

Q: Bearing in mind that most chasers operate on a tight budget, what advice would you offer someone who is thinking about purchasing RAOB? Which modules will be most helpful, and why?

J: Tight budgets are getting even tighter these days and that’s why there is now the new RAOB Lite program. It lists for $50.00 and lasts much longer than light beer. You buy it, you own it. You get free technical support, a free upgrade to the next release, and discounts thereafter. The Lite program contains the two most popular data decoders: WMO and BUFKIT. It does not contain the above, advanced interactive features, but it does contain the multi-sounding scanner screen and provides all the essential graphic and text displays for severe weather detection.

If more detail and capability are needed, then an upgrade to the RAOB Basic program is the next step. This gives access to the SHARP, UWYO, and CSV decoders plus many more graphic and text configuration options. Once you have the RAOB Basic program, then any other optional program module can be added. Without a doubt, the most popular optional module is the Analytic module. It provides the advanced severe weather display and text options in addition to many other features.

For those more advanced users, the Interactive and Hodograph module is a must. This turns RAOB into a powerful diagnostic tool. Its interactive capabilities let the user measure the sounding’s “sensitivity” to change. Just the slightest change in surface temperature or dewpoint can make a significant change in the commonly used severe weather indices, such as CAPE, LI, and so forth. Most people use these parameters at first sight; they don’t consider, “What if the surface temperature increased by just one degree?” The results can be dramatic. While sounding sensitivity is very important for lengthy forensic studies, it can also be very useful for quickly evaluating the storm potential of one sounding versus another. Note that this module also contains an advanced hodograph screen which provides detailed analyses of storm motion and related wind shear data.

RAOB has many other optional program modules, each of which is suited for more advanced and special needs. However, one other module that is also useful to storm chasers is the Cross-Section module, which can also produce time-sections of multi-sounding forecast files. One important feature of this module is its meteogram display, which plots the trends of key severe weather indices over the forecast time period.

Q: What advances do you envision for RAOB in the future—say, within the next five years? Any new modules, new capabilities, or perhaps new partnerships in the works?

J: The RAOB factory now operates seven days a week, except for an occasional polka or waltz. Several projects are under construction while others anxiously sit on a prioritized to-do list.

Coming with the next new RAOB release this fall will be the biggest program enhancement since RAOB’s conversion from DOS to Windows. You’re hearing it first right here. The announcement was originally planned for a future American Meteorological Society magazine ad, but the prototype is ahead of schedule and can now be made public. This enhancement is not a new module, but a new screen called the Custom View display. It will be accessible for those with the Basic program at no additional cost.

The Custom View will permit the user to design a personal display screen. You will be able to position and size any combination of sounding and cross-section diagrams for synchronized data displays. Sounding diagrams include skew-T, hodograph, mountain-wave, and soundingram images. The first edition of this screen will only allow placement of graphic diagrams, but later editions will also include text and image objects.

The Custom View screen will satisfy several customer requests at the same time.  It will also be very useful for those with unique wide-screen and vertical-screen monitors. Diagram configuration options will jump from the current 200 or so graphic options to infinite possibilities.

The next major enhancement will be in the area of real-time data processing, especially for non-traditional soundings. These soundings include radiometric, acoustic, sodar, and lidar soundings, which are all becoming more available as these technologies rapidly develop. Although these non-traditional soundings only measure the lower atmosphere, they produce sounding profiles every few minutes or even seconds. This is the wave of the future for weather soundings and will transform how we see the atmosphere, just as Doppler technology accelerated weather radar advances. This data will become absolutely essential to storm chasers—not to mention everyone else.

Beyond these ongoing and planned projects, there are many others on the to-do list, while still others are in the discussion phase. As always, RAOB development responds to customer requests. The more requests received for a particular feature, the faster it becomes reality. New data decoders have the highest priority, since without the ability to ingest and process the data, all else is irrelevant. So, if anyone has a new data or a new need, just contact RAOB.com and let’s talk about it.

Q: Do you chase storms yourself, or was there ever a time in your life when you did?

J: I did get out a few times, but without much success. While stationed at March Air Force Base in southern California, I saw several large dust devils, but they were in hot, dry weather. However, while stationed at my first Air Force job at Offutt AFB in Nebraska, I saw something unusual. At that time I was living in a trailer on a hill—perfect for severe weather monitoring. I saw a pre-tornadic collar or wall cloud. It was large, slowly rotating, and composed of very dark green and blackish clouds.

What an incredible sight! And it was headed toward Omaha. I would have hopped in the car and gone for the chase, but I had to get ready for my weather forecast shift at Offutt AFB. I later found out that an F4 tornado developed and ripped through west-central sections of Omaha on May 6, 1975.

Q: What is your favorite kind of weather? What are some aspects of weather that particularly fascinate you or that you simply enjoy?

J: That’s easy—the awesome stuff. Anything that requires a warning gets my attention. While tornado forecasting is challenging, I found typhoon forecasting particularly exciting. I spent three years on Guam as a typhoon duty officer and loved every minute of it—but that’s another story. Typhoons and hurricanes are the king of the hill when it comes to weather phenomena. They even spawn tornados. Regarding a more subtle, weather-related event, I’m still trying to get my first glimpse of the elusive “green flash.”

———————–

There you have it: RAOB as discussed by its inventor. If this post has a somewhat commercial tone to it, take it in stride. RAOB is John’s business, and obviously he’d like to sell his product. But it’s an absolutely amazing product because it began, and continues, first and foremost as one man’s passion. Having used it for a couple years, I wanted to find out more about its development and its developer and offer my storm chasing and weather readers an article that would be both interesting and useful. The initiative has been my own, and I’ve made no money out of the effort.

While links aplenty have been furnished above, I’ll conclude with one last, handy link to the RAOB homepage in case you’d like to find out more.

Storm Chasing in Illinois on Wednesday

The formidable system that ground out large, violent tornadoes in Kansas, Oklahoma, and Texas on Tuesday will move east on Wednesday to bring another round of severe weather to southeast

Missouri, Illinois, and Indiana. And finally–finally!–I’m in a position to do some storm chasing. Financial constraints have majorly crimped my expeditions so far this season, but no way am I missing tomorrow.

Based on Tuesday morning’s NAM run, I’d been eyeballing Effingham, Illinois, as a preliminary target for trolling the I-70 corridor. The sounding for that area looked mighty pretty, as you can plainly see.

Now, however, with the 00Z runs in, I’m inclined to shift farther east near Terre Haute. Here’s another model sounding, courtesy of TwisterData, for near Oblong, Illinois. Maybe not quite as sexily backed at the surface as the Effingham sounding, but with stronger low-level winds and definitely quite functional. Maps of 500 mb winds and SBCAPE (see below) paint in a little more detail and suggest that near the Illinois/Indiana border is a good choice.

Tomorrow morning’s data will tell all. Meanwhile, it’s time for me to get my ugly-rest. I am so excited about the prospect of finally getting out and feeling the moisture, watching cumulus towers erupt and organize into glowering supercells, and hopefully videotaping some tornadoes out on the flat, wide-open Illinois prairie! A good night’s sleep and then I’m off in the morning.

First Great Plains Chase of 2011 This Wednesday

At last, the setup I’ve been waiting for–one that warrants dipping into my tight finances in order to make the 1,000-mile drive to the Southern Plains. To date, this present system has been a miserable disconnect between upper-level support and instability, with a nasty cap clamping down on the whole shebang. Last night it managed to cough up a solitary tornado in South Dakota. That was it. I’m not sure what today holds, but I haven’t seen anything to excite me about it or tomorrow.

But Wednesday…ah, now we’re talking! The SPC places a large section of the Great Plains under a slight risk, and their discussions have been fairly bullish about the potential for a wide-scale event. At first I couldn’t see why. My mistake–I was looking at the NAM, which with straight southerly H5 winds has not provided the best PR for Wednesday’s setup. But once I glommed the GFS, I got a whole ‘nother picture, one which the SREF and Euro corroborated.

That was last night. I haven’t looked at today’s SREF, and the new ECMWF gives me a slight pause as its now somewhat negative tilt has slightly backed the mid-levels from the previous run. But only slightly. The H5 winds still have a nice southwesterly flow, and taking the three models together, everything you could ask for is lining up beautifully for tornadoes in the plains.

The event promises to be widespread, with a robust dryline stretching from a triple point in southwest Kansas south through Oklahoma and Texas. Positioned near a dryline bulge, Enid, Oklahoma has drawn my attention for the last couple of GFS runs. Check out this model sounding for 00Z and tell me what’s not to like about it. Everything is there, including a voluptuous hodograph and 1 km SRH in excess of 300 m^2/s^2.

Other places in the region also look good, though. Farther south in Texas, Wichita Falls shows potential. Helicity isn’t as persuasive as Enid, but the CAPE tops 3,000 J/kg and there’s less

convective inhibition. Here’s the sounding for you to compare with Enid.

I haven’t been as drawn to Kansas so far, but with the triple point perched there, storms are bound to fire up just fine in the Sunflower State. The details will work themselves out between now and Wednesday evening. Significantly, the tyrannical cap of the previous few days no longer appears to be an issue.

The bottom line is–it’s time to head West! This evening I’m taking off for the plains with my long-time chase buddy Bill. At last! Time to sample what the dryline has to offer, and–now that I’m equipped with a great HD camcorder–finally get some quality footage of a tornado or two.

There’s no place like the Great Plains! YeeeeHAW!!!!!

Remembering April 11, 1965: Highlights of the Palm Sunday Tornado Memorial Service

If you’ve been following this blog lately, then you’re well aware that yesterday was the 45th anniversary of the 1965 Palm Sunday Tornado Outbreak. The commemoration held at the Tornado Memorial Park in Dunlap, Indiana, came together beautifully thanks to the hard work of my friend Debbie Watters, who owns the park. To say that it was a memorable event understates some of the truly amazing things that transpired.

Dan McCarthy, the meteorologist in charge at KIND in Indianapolis, was the keynote speaker. Dan did a superb job describing the strides that severe weather forecasting and the warning system have taken since 1965, and explaining how the Palm Sunday Outbreak served as a catalyst for those changes. If there is any comfort to hearts that still ache over the loss of loved ones in the storms, Dan suggested that at least part of it may lie in knowing that a tornado catastrophe of such magnitude is unlikely to ever happen again.

Several other speakers followed Dan. Last of all was Debbie. I think one reason she does so well behind a microphone is that she pours her heart out toward her listeners. At a gathering of tornado survivors and their families, the needs may not be readily apparent; but Debbie, having lost her brother Stevie in the Dunlap F5, knows what lies below the surface. It had to have taken some courage to address the subject of survivor guilt as honestly and

straightforwardly as Debbie did, but it’s only in shining light on such a painful issue that its grip can perhaps be broken on people who, over four decades later, still wonder why they lived while their loved one died

At the end of the service, there was a balloon launch in loving memory of the Elkhart County tornado victims. It was a poignant moment, watching those bright, merry balloons soar skyward into the blue.

But it was the behind-the-scenes happenings, the interpersonal connections, that will live on in my mind. There were some heartwarming moments, and a few that were just plain incredible. Debbie had always wondered who the stranger was who saved her mother’s life after the tornado, and who sheltered the two of them in his car until an ambulance arrived. Yesterday, a woman introduced herself to Debbie as the man’s wife. You can imagine what a powerful meeting that was for both women.

Among the roughly 150 attendees, I was delighted to see Paul and Elizabeth Huffman. Paul is the retired Elkhart Truth photographer who took the famous image of twin funnels straddling US 33 south of Dunlap, destroying the Midway Trailer Court. That photo, one of six in a sequence, is arguably the most famous and dramatic tornado photograph of all time, and one that has inspired more than one young kid to pursue meteorology as a career.

Now in his eighties, Paul is a peppery and humorous personality, and his wife, Elizabeth, is a sweetheart. It was fascinating, in talking with them, to get insights into how things played out that day. Paul wasn’t even aware of the twin-funnel structure when he snapped the photo; in his viewfinder he saw just the rightmost funnel. It was only when the startling image of “The Twins” emerged in development that Paul realized he had captured something extraordinary on film.

I was particularly pleased when one of the speakers, Brian Beaver–an award-winning radio correspondent formerly with IPR–took time to publicly recognize Paul and honor him for his achievement.

My friend Pat Bowman and her brother John were also present. But of course they would be–Pat is integrally knit into these events. She and Deb are my two “tornado ladies,” dear to each other and to me. The way that the three of us connected is a pretty incredible story in its own right, and it all started with Pat. Actually, it started long before, with a newspaper account of a young couple’s tragic loss of their child, and of a small boy’s prayers for them in response. There is a reason that Pat is very special to me. But that story is for another time.

The last photo on this page is one I will always treasure. That’s Elizabeth and Paul Huffman on the left. Debbie is the blonde, and that’s Pat on the right. God gifts us with people, and it was a blessing to me to see these four together. The threads of events that connect them are intricate and remarkable, and I feel privileged to see the connections continue to unfold in their lives and in mine.