First Great Plains Chase of 2011 This Wednesday

At last, the setup I’ve been waiting for–one that warrants dipping into my tight finances in order to make the 1,000-mile drive to the Southern Plains. To date, this present system has been a miserable disconnect between upper-level support and instability, with a nasty cap clamping down on the whole shebang. Last night it managed to cough up a solitary tornado in South Dakota. That was it. I’m not sure what today holds, but I haven’t seen anything to excite me about it or tomorrow.

But Wednesday…ah, now we’re talking! The SPC places a large section of the Great Plains under a slight risk, and their discussions have been fairly bullish about the potential for a wide-scale event. At first I couldn’t see why. My mistake–I was looking at the NAM, which with straight southerly H5 winds has not provided the best PR for Wednesday’s setup. But once I glommed the GFS, I got a whole ‘nother picture, one which the SREF and Euro corroborated.

That was last night. I haven’t looked at today’s SREF, and the new ECMWF gives me a slight pause as its now somewhat negative tilt has slightly backed the mid-levels from the previous run. But only slightly. The H5 winds still have a nice southwesterly flow, and taking the three models together, everything you could ask for is lining up beautifully for tornadoes in the plains.

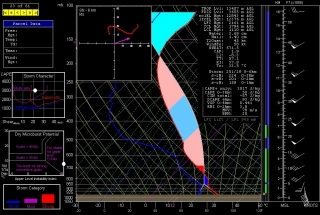
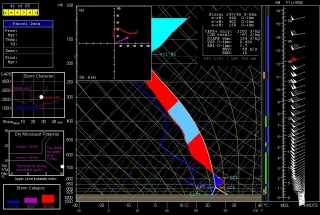
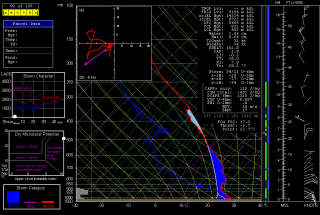
The event promises to be widespread, with a robust dryline stretching from a triple point in southwest Kansas south through Oklahoma and Texas. Positioned near a dryline bulge, Enid, Oklahoma has drawn my attention for the last couple of GFS runs. Check out this model sounding for 00Z and tell me what’s not to like about it. Everything is there, including a voluptuous hodograph and 1 km SRH in excess of 300 m^2/s^2.

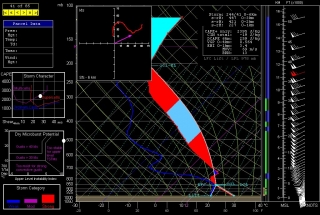
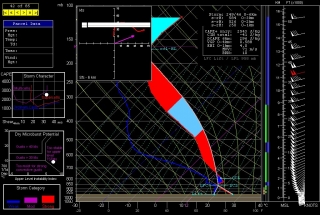
Other places in the region also look good, though. Farther south in Texas, Wichita Falls shows potential. Helicity isn’t as persuasive as Enid, but the CAPE tops 3,000 J/kg and there’s less

convective inhibition. Here’s the sounding for you to compare with Enid.

I haven’t been as drawn to Kansas so far, but with the triple point perched there, storms are bound to fire up just fine in the Sunflower State. The details will work themselves out between now and Wednesday evening. Significantly, the tyrannical cap of the previous few days no longer appears to be an issue.

The bottom line is–it’s time to head West! This evening I’m taking off for the plains with my long-time chase buddy Bill. At last! Time to sample what the dryline has to offer, and–now that I’m equipped with a great HD camcorder–finally get some quality footage of a tornado or two.

There’s no place like the Great Plains! YeeeeHAW!!!!!
Monday’s Southern Plains Event

Lacking the cash to head west for tomorrow’s setup, the best I’m going to be able to do is gaze forlornly at the radar, gnash my teeth, and hope my buddies Bill, Kurt, and Mike are catching tornadoes and staying safe.

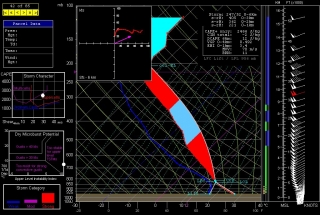
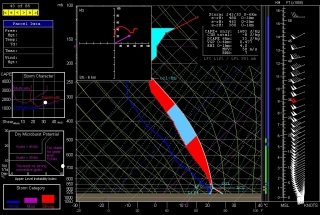
I’d be smart to not even look at the models, but a perverse part of human nature makes it hard for me not to. Out of curiosity, I’ve interrogated a few NAM 6Z forecast soundings from around southeast Kansas and northeast Oklahoma. I suppose the results are nothing new: plenty of moisture and CAPE, great shear and helicity, and a stout cap that lingers till evening, at which point the atmosphere looks primed for discrete, tornadic supercells to explode.

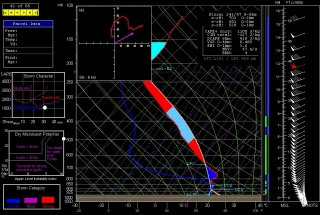
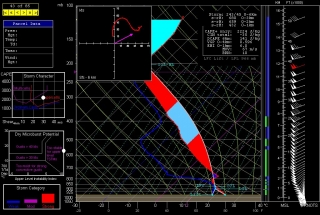
Most of the soundings shown here are for 23Z, but the one for Tulsa, shown above, is for 22Z, since the cap looks to minimize earlier there (21Z, not shown, also looks decent, with -46 J/kg CINH, up from -198 the previous hour). For KCNU (Chanute, KS), I’ve also shown the 00Z so you can compare the difference; and for Hutchinson, which at 525 1km SRH has the highest helicity value of the different soundings, and for Wichita, I’ve shown only the 00Z, since prior to that the cap looks pretty stout. Look below for all the soundings except Tulsa, and make sure you click on the images to enlarge them.

Beyond this, I’m not going to comment. To those who are out there on the Plains waiting for this setup to arrive and ripen, I wish you success and safety.

Forecast Model Simulations for 1965 Palm Sunday Tornadoes: Part 2

The drive down to the WFO at State College, Pennsylvania, was well worth my while (see my previous post). Operational forecaster and research meteorologist David Beachler was a pleasure to work with–personable, patient, and eager to help me understand the exhaustive forecast simulations he had produced on the 1965 Palm Sunday Tornadoes. Having pored over the data with David, gaining his insights on its strengths and weaknesses, I am now extremely excited about what I’ve got on my hands.

David’s modeling uses the WRF-ARW 40 km. The resolution is too coarse to offer the fine details that the SPC is capable of producing, but it gives an excellent overall feel of what forecasters and storm chasers might see in the models if the Palm Sunday synoptic setup were to unfold today instead of forty-five years ago in 1965.

no images were found

There’s no way I can begin to cover all the material, which in any case I need to sift through in order to put together a reasonably concise and meaningful scenario. But I can at least give you a sample of some of the stuff I’ve got to work with. Click on the following images to enlarge them.

First, here is a hand analysis of the kind that is accessible to anyone through NOAA’s historical daily weather maps archives. Besides the surface map for April 11, 1965, you also get the previous day’s surface map, 500 mb chart, and other info. It’s what you would have encountered when you turned to the weather page in the newspaper that morning.

What you would never have seen–because parameters such as CAPE, CIN, helicity, and so on didn’t exist back then, and because even if they had existed, the forecast models which could have depicted them were still years down the road–is this map showing SBCAPE and low-level shear.

The map is for 2200Z, or 6 p.m. EST–roughly the time at which tornadoes began moving through northern Indiana.

It gets even better. Here is a model sounding for KGRR, also at 2200Z, using WRF-ARW Bufkit data. The skew-T and hodograph depict the conditions that were shaping up to produce the F4 Alpine Avenue tornado that formed

around 6:50 p.m., as well as other tornadoes in west and southwest Michigan that day. The helicity is impressive–and look at those winds! Forty knots at 850 millibars is no mere puff of air.

What really excites me is that, using RAOB’s cross-section feature, I should be able to reconstruct a vertical profile of the atmosphere for the entire outbreak area. I’m not sure how deeply I want to go with that, but I have the capacity.

Bear in mind that I’m just showing a couple of representative glimpses derived from a 00Z, day-one model initiation. In fact, David provided me with a range of initiation times that allows me to get a good sense of how the maps might have progressed from several days prior to the actual tornado outbreak.

In practical terms, the maps and model sounding data I’ve got correlate to the NAM. They’re not the NAM, but for storm chasers who typically work with the GFS, ECMWF, GEM, NAM, and RUC, what you see here is probably closest to what you’d find using the North American Mesoscale Model.

That’s all for now. This has been a time-consuming post, and at 2:30 in the afternoon, I need to pull away from it so I can bathe and eat. I didn’t arrive home until 3:00 a.m., so it’s time for this road warrior to reset his time clock and get on with the rest of life.

RAOB and Other Weather Widgets

Some storm chasers pride themselves in being minimalists who have a knack for intercepting tornadoes without much in the way of gadgetry. Others are techies whose vehicles are tricked out with mobile weather stations and light bars. It’s all part of the culture of storm chasing, but the bottom line remains getting to the storms.

To my surprise, while I draw the line at gaudy externals, I’ve discovered that I lean toward the techie side. For me, storm chasing is a lot like fishing. Once you’ve bought your first rod and reel and gotten yourself a tackle box, you find that there’s no such thing as having enough lures, widgets, and whizbangs. You can take the parallels as deep as you want to. Radar software is your fish finder. F5 Data, Digital Atmosphere, and all the gazillion free, online weather maps from NOAA, UCAR, COD, TwisterData, and other sources are your topos. And so it goes.

A couple years ago I spent $300 on a Kestrel 4500 weather meter. It’s a compact little unit that I wear on a lanyard when I’m chasing. It weighs maybe twice as much as a bluebird feather, but it will give me temperature, dewpoint, wind speed, headwinds, crosswinds, wind direction, relative humidity, wet bulb temperature, barometric pressure, heat index, wind chill, altitude, and more, and will record trends of all of the above.

I use it mostly to measure the dewpoint and temperature.

Could I have gotten a different Kestrel model that would give me that same basic information for a third of the cost, minus all the other features that I rarely or never use? Heck yes. Nevertheless, I need to have the rest of that data handy. Why? Never mind. I just do, okay? I need it for the same reason that an elderly, retired CEO needs a Ferrari in order to drive 55 miles an hour for thirty miles in the passing lane of an interstate highway. I just never know when I might need the extra informational muscle–when, for instance, knowing the speed of crosswinds might become crucial for pinpointing storm initiation.

If I lived on the Great Plains, with Tornado Alley as my backyard, I might feel differently. But here in Michigan, I can’t afford to head out after every slight-risk day in Oklahoma. Selectivity is important. I guess that’s my rationale for my preoccupation with weather forecasting tools, along with a certain vicarious impulse that wants to at least be involved with the weather three states away even when I can’t chase it. Maybe I can’t always learn directly from the environment, but I can sharpen my skills in other ways.

Does having all this stuff make me a better storm chaser? No, of course not. Knowledge and experience are what make a good storm chaser, and no amount of technology can replace them. Put a $300 Loomis rod in the hands of a novice fisherman and chances are he’ll still come home empty-handed; put a cane pole in the hands of a bass master and he’ll return with a stringer full of fish. On the other hand, there’s something to be said for that same Loomis rod in the hands of a pro, and it’s not going to damage a beginner, even if he’s not capable of understanding and harnessing its full potential. Moreover, somewhere along the learning curve between rookie and veteran, the powers of the Loomis begin to become apparent and increasingly useful.

Now, I said all of that so I can brag to you about my latest addition to my forecasting tackle box: RAOB (RAwinsonde OBservation program). This neat little piece of software is to atmospheric soundings what LASIK is to eye glasses. The only thing I’ve seen that approaches it is the venerable BUFKIT, and in fact, the basic RAOB program is able to process BUFKIT data. But I find BUFKIT difficult to use to the point of impracticality, while RAOB is much easier in application, and, once you start adding on its various modules, it offers so much more.

RAOB is the world’s most powerful and innovative sounding software. Automatically decodes data from 35 different formats and plots data on 10 interactive displays including skew-Ts, hodographs, & cross-sections. Produces displays of over 100 atmospheric parameters including icing, turbulence, wind shear, clouds, inversions and much more. Its modular design permits tailored functionality to customers from 60 countries. Vista compatible.

–From the RAOB home page

The basic RAOB software arrived in my box a couple weeks ago courtesy of Weather Graphics. It cost me $99.95 and included everything needed to customize a graphic display of sounding data from all over the world.

I quickly realized, though, that in order to get the kind of information I want for storm chasing, I would also need to purchase the analytic module. Another $50 bought me the file, sent via email directly from RAOB. I downloaded it last night, and I have to say, I am absolutely thrilled with the information that is now at my disposal.

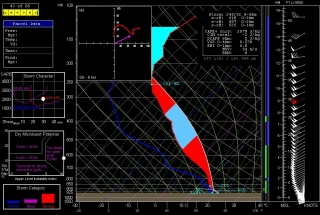
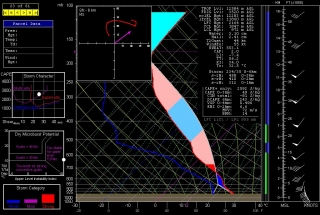
Here is an example of the RAOB display, including skew-T/log-P diagram with lifted parcel, cloud layers, hodograph, and tables containing ancillary information. Click on the image to enlarge it. The display shown is the severe weather mode, with the graphs on the left depicting storm character, dry microburst potential, and storm category. (UPDATE: Also see the more recent example at the end of this article.)

The sounding shown is the October 13, 2009, 12Z for Miami, Florida–a place that’s not exactly the Zion of storm chasing, but it will do for an example. Note that the negative area–that is, the CIN–is shaded in dark blue. The light blue shading depicts the region most conducive to hail formation. Both are among the many available functions of the analytic module.

The black background was my choice. RAOB is hugely customizable, and its impressive suite of modules lets you tailor-make a sounding program that will fit your needs beautifully. Storm chasers will want to start with the basic and analytic modules. With that setup, your $150 gets you a wealth of sounding data on an easy-to-use graphic interface. It’s probably all you’ll ever need and more–though if you’re like me, at some point you’ll no doubt want to add on the interactive and hodo module.

And the special data decoders module.

Oh yeah, and the turbulence and mountain wave module. Gotta have that one.

Why?

Never mind. You just do, okay?

ADDENDUM: With a couple storm seasons gone by since I wrote the above review, I thought I’d update it with this more timely image. If you’re a storm chaser, you’ll probably find that what the atmosphere looked like in May in Enid, Oklahoma, is more relevant to your interest than what it looked like in Miami in October.

A Stormy Friday in Grand Rapids?

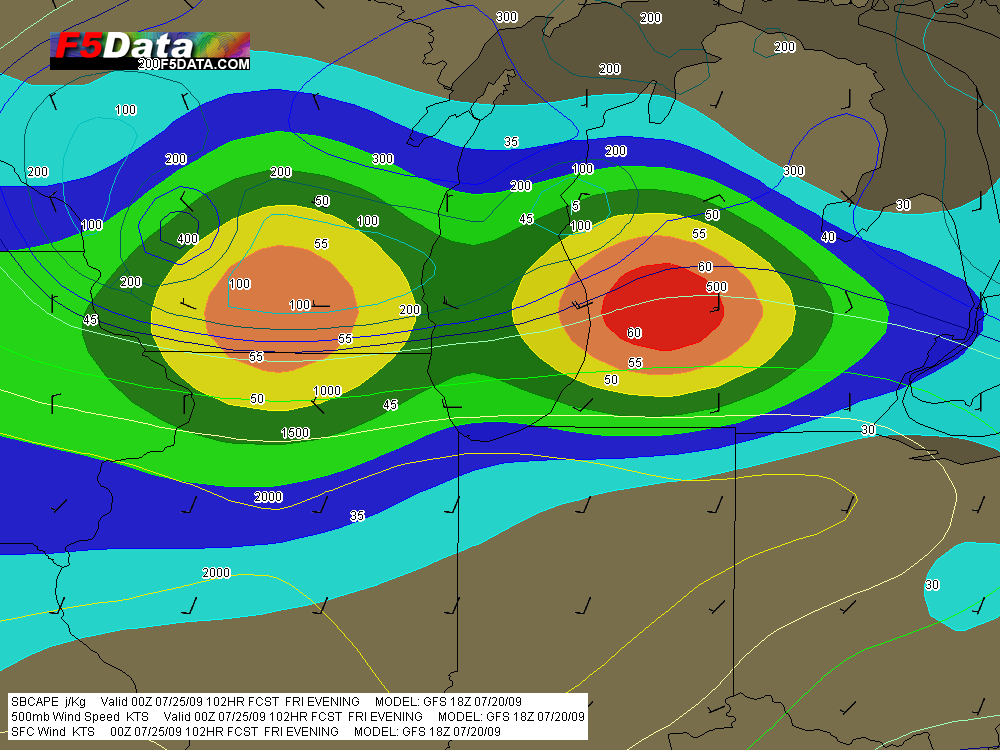
Out of idle curiosity, I ran the latest GFS and came up with the image below. The colored shading is 500 mb winds, and the contours are CAPE. Not shown: H7 temps of 4 C throughout Michigan, 50-60 kt bulk shear, and dewpoints in the mid-60s.

GFS for 00Z Friday evening, July 24.

GFS for 00Z Friday evening, July 24.

CAPE stinks, but I’ve got to love that jet streak parked right over Grand Rapids. Without decent convective energy, this setup is hard to get too hopped up about, but it’s certainly worth keeping an eye on. Probably a pipe dream in July, but in this part of the country you just never know.

Midweek Severe Weather Potential for the Midwest

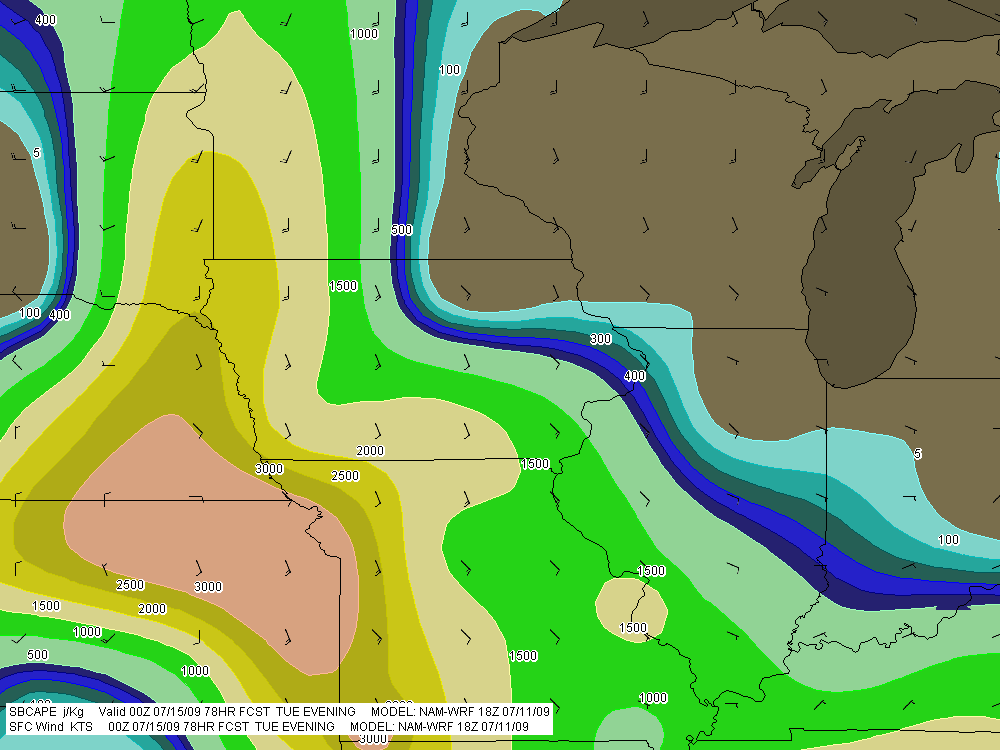
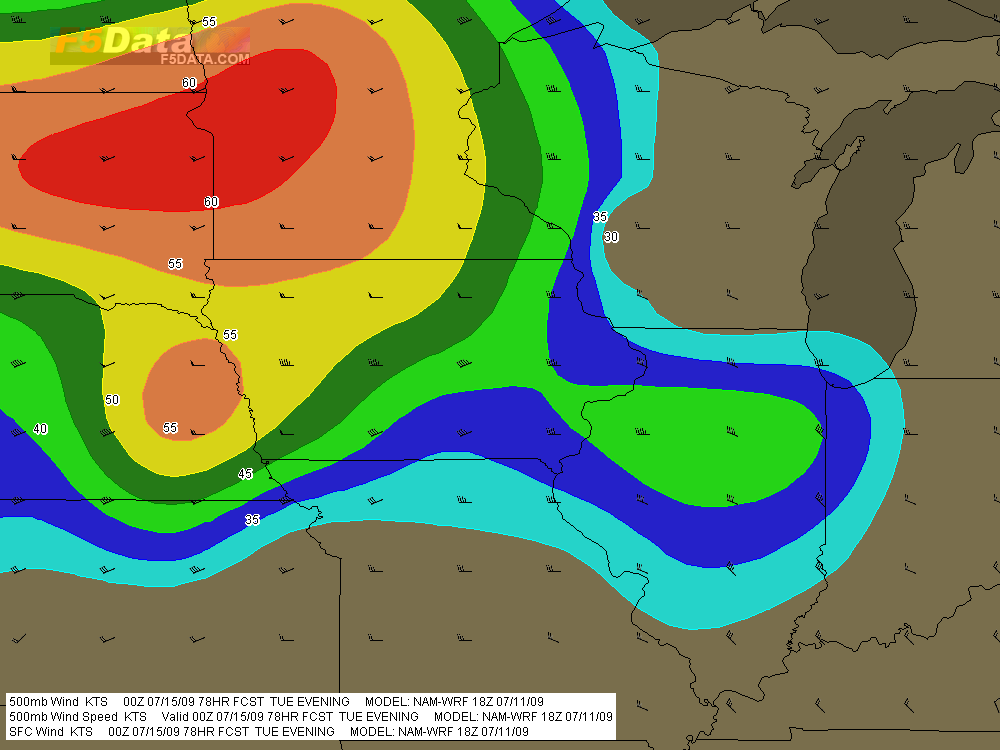
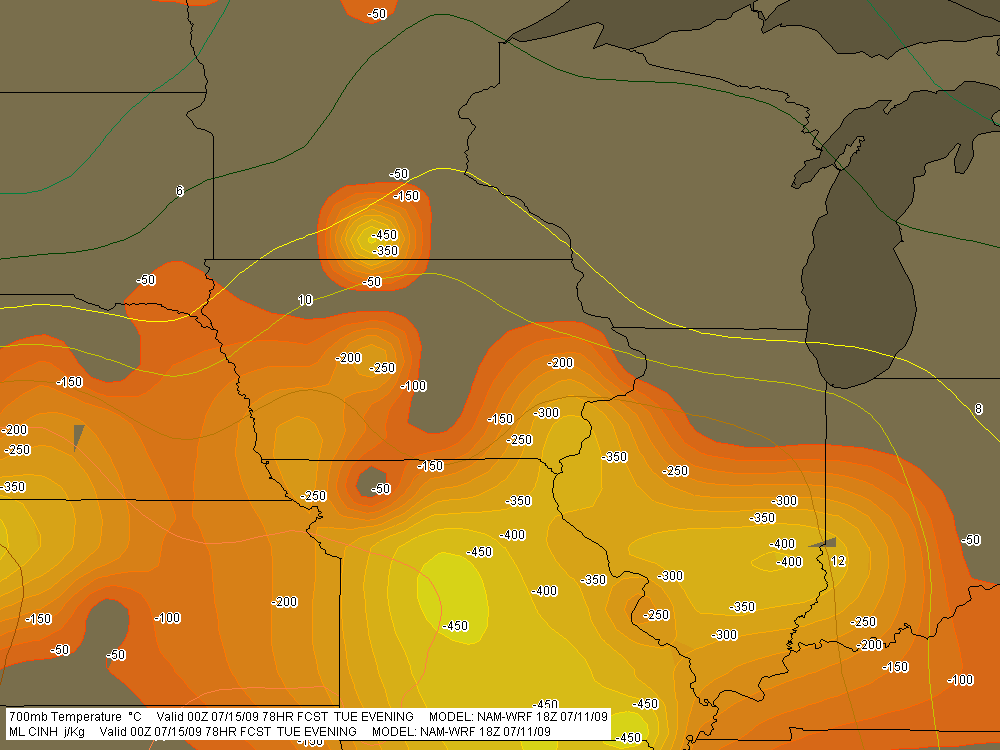
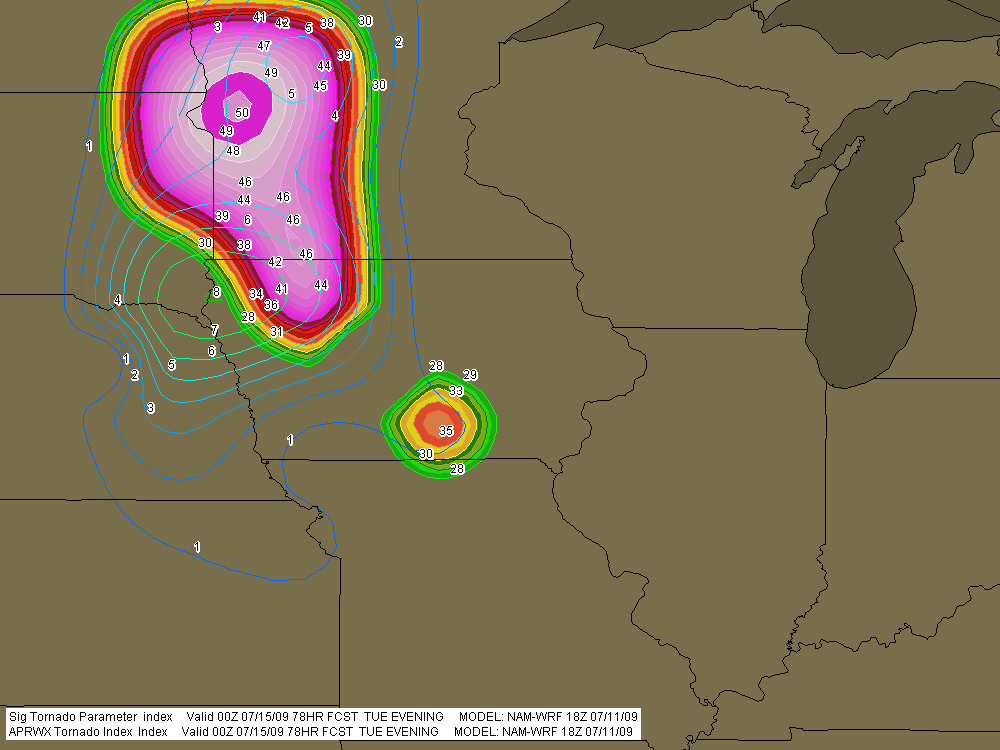
A significant weather event appears to be shaping up for the northern plains and cornbelt this coming Tuesday. For all you weather buffs and storm chasers, here are a few maps from the 18Z NAM-WRF run for 7 p.m. CT Tuesday night (technically, 00Z Wednesday), courtesy of F5 Data.

A couple items of note:

* The NAM-WRF is much less aggressive with capping than the GFS.  The dark green 700mb isotherm that stretches diagonally through central Minnesota marks the 6 C contour, and the yellow line to its south is the 8 C isotherm.

* The F5 Data proprietary APRWX Tornado Index shows a bullseye of 50, which is quite high (“Armageddon,” as F5 software creator Andy Revering puts it). The Significant Tornado Parameter is also pretty high, showing a  tiny bullseye of 8 in extreme northwest Iowa by the Missouri River.

Obviously, all this will change from run to run. For now, it’s enough to say that there may be a chase opportunity shaping up for Tuesday.

As for Wednesday, well, we’ll see. The 12Z GFS earlier today showed good CAPE moving into the southern Great Lakes, but the surface winds were from the west, suggesting the usual linear junk we’re so used to. We’ve still got a few days, though, and anything can happen in that time.

SBCAPE in excess of 3,000 j/kg with nicely backed surface winds throughout much of region.

SBCAPE in excess of 3,000 j/kg with nicely backed surface winds throughout much of region.

500mb winds with wind barbs.

500mb winds with wind barbs.

MLCINH (shaded) and 700mb temperatures (contours).

MLCINH (shaded) and 700mb temperatures (contours).

APRWX Tornado Index (shaded) and STP (contours). Note exceedingly high APRWX bullseye.

APRWX Tornado Index (shaded) and STP (contours). Note the exceedingly high APRWX bullseye.

Moderate Risk in West Oklahoma and Texas

My buddies Bill and Tom Oosterbaan and Derek Mohr are heading for today’s sweet zone out in western Oklahoma. The Storm Prediction Center has placed the area under a moderate risk, with an indication of strong tornadoes. No doubt. With CAPE exceeding 2,000 and decent helicity and upper-level support increasing by 0Z, all the ingredients will be there. I’d imagine the guys will be playing the triple point per the SPC, where helicity will be maximized. Should be quite the caravan out there today. A person with a popcorn truck and GR3 could make a killing on a chase day.

Farther north, back here in Michigan, we’re sitting under our first light risk day of the year. As I write, it’s approaching 11 a.m. and the temperature is already in the upper 70s with dewpoints tapping on 60 degrees. But the forecast soundings look miserable, with adequate bulk shear but squat in the way of directional turning and some truly weird-looking hodographs. The sounding for 21Z out in the east central Texas panhandle, on the other hand, out around Mobeetie and Wheeler, looks great.

Sigh.

Well, we’ve got rain outside. Big drops.

At least “the kids”–my collection of carnivorous plants–will be happy. I just potted my three latest arrivals: a parrot pitcher plant, a maroon-throat variety of the pale pitcher plant, and the Gulf variety of the sweet pitcher plant. They’re sitting out on the deck along with the rest of my little family, soaking in the warmer temperatures, humidity, ambient light, and now the precip. It’s a fine day for the plants here in Michigan, and a good one as well for writers and jazz musicians if not storm chasers.

Time to fire up the radar and see what’s on the way.